R.Du Hyun RoOrthopedics & Research
Text

Research starts in clinical care

Orthopedic AI & Robotics Lab

We aim to assess joint health objectively, quantify changes and predict future outcomes. Our work in imaging AI, surgical robotics and Physical AI connects clinical research with products at CONNECTEVE.

Research-room concept illustration

RESIDENTS & FELLOWS

Knee Surgery Teaching Notes

Explore examination and revision surgery alongside TKA, UKA and ACL through lecture figures and topic-by-topic explanations.

PRESENTATIONS

Presentations and Links

Find papers, slides and videos related to lectures and conference presentations.

Research papers

My research centers on objective arthritis assessment, quantified structural change and individual prognosis. It has expanded through knee alignment, imaging biomarkers, gait, arthroplasty, osteotomy, ligament surgery, medical AI and robotics. Browse the full list for the research trajectory, then follow original figures and technical explanations for papers of interest.

132 Research catalogue63 Detailed Paper Explanations56 Full Texts Reviewed46 Figures and charts
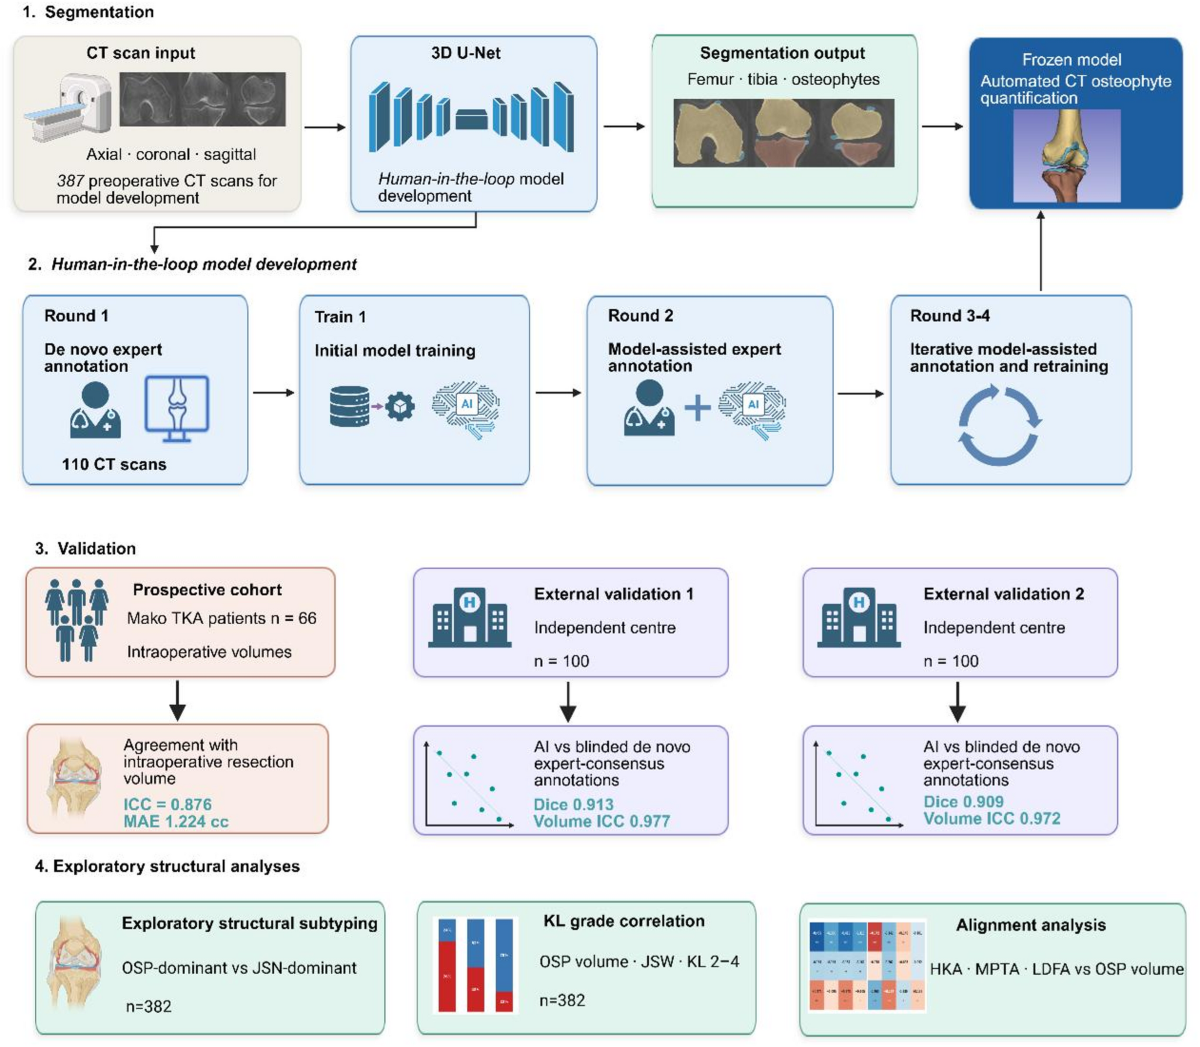
Original workflow showing AI development, two external validation cohorts and surgical-cohort assessment.
2026-10-06Original figures and charts
AICTosteophyte

Can CT automatically quantify the location and volume of knee osteophytes?

Median osteophyte Dice was 0.913 and 0.909 in the external cohorts; volume ICC was 0.977 and 0.972.

Abstract · Original text

Zhiqian Zheng, Do Weon Lee, Sewon Jeon, Hong Yeol Yang, Jong Keun Seon, Ho-Jung Jung, Joong Il Kim, Byung Sun Choi, Hyuk-Soo Han, Du Hyun Ro. Automated CT-based quantification of knee osteophytes for robotic-assisted total knee arthroplasty: a multi-cohort study. Journal of Robotic Surgery. 2026. doi:10.1007/s11701-026-04015-y.

Excerpt from the original abstract

Preoperative computed tomography (CT) is routinely acquired for planning robotic-assisted total knee arthroplasty (TKA), yet osteophyte burden is not quantitatively characterized.

Keywords

  • AI
  • CT
  • osteophyte
  • external validation
  • robotic TKA

© 2026 The Author(s).

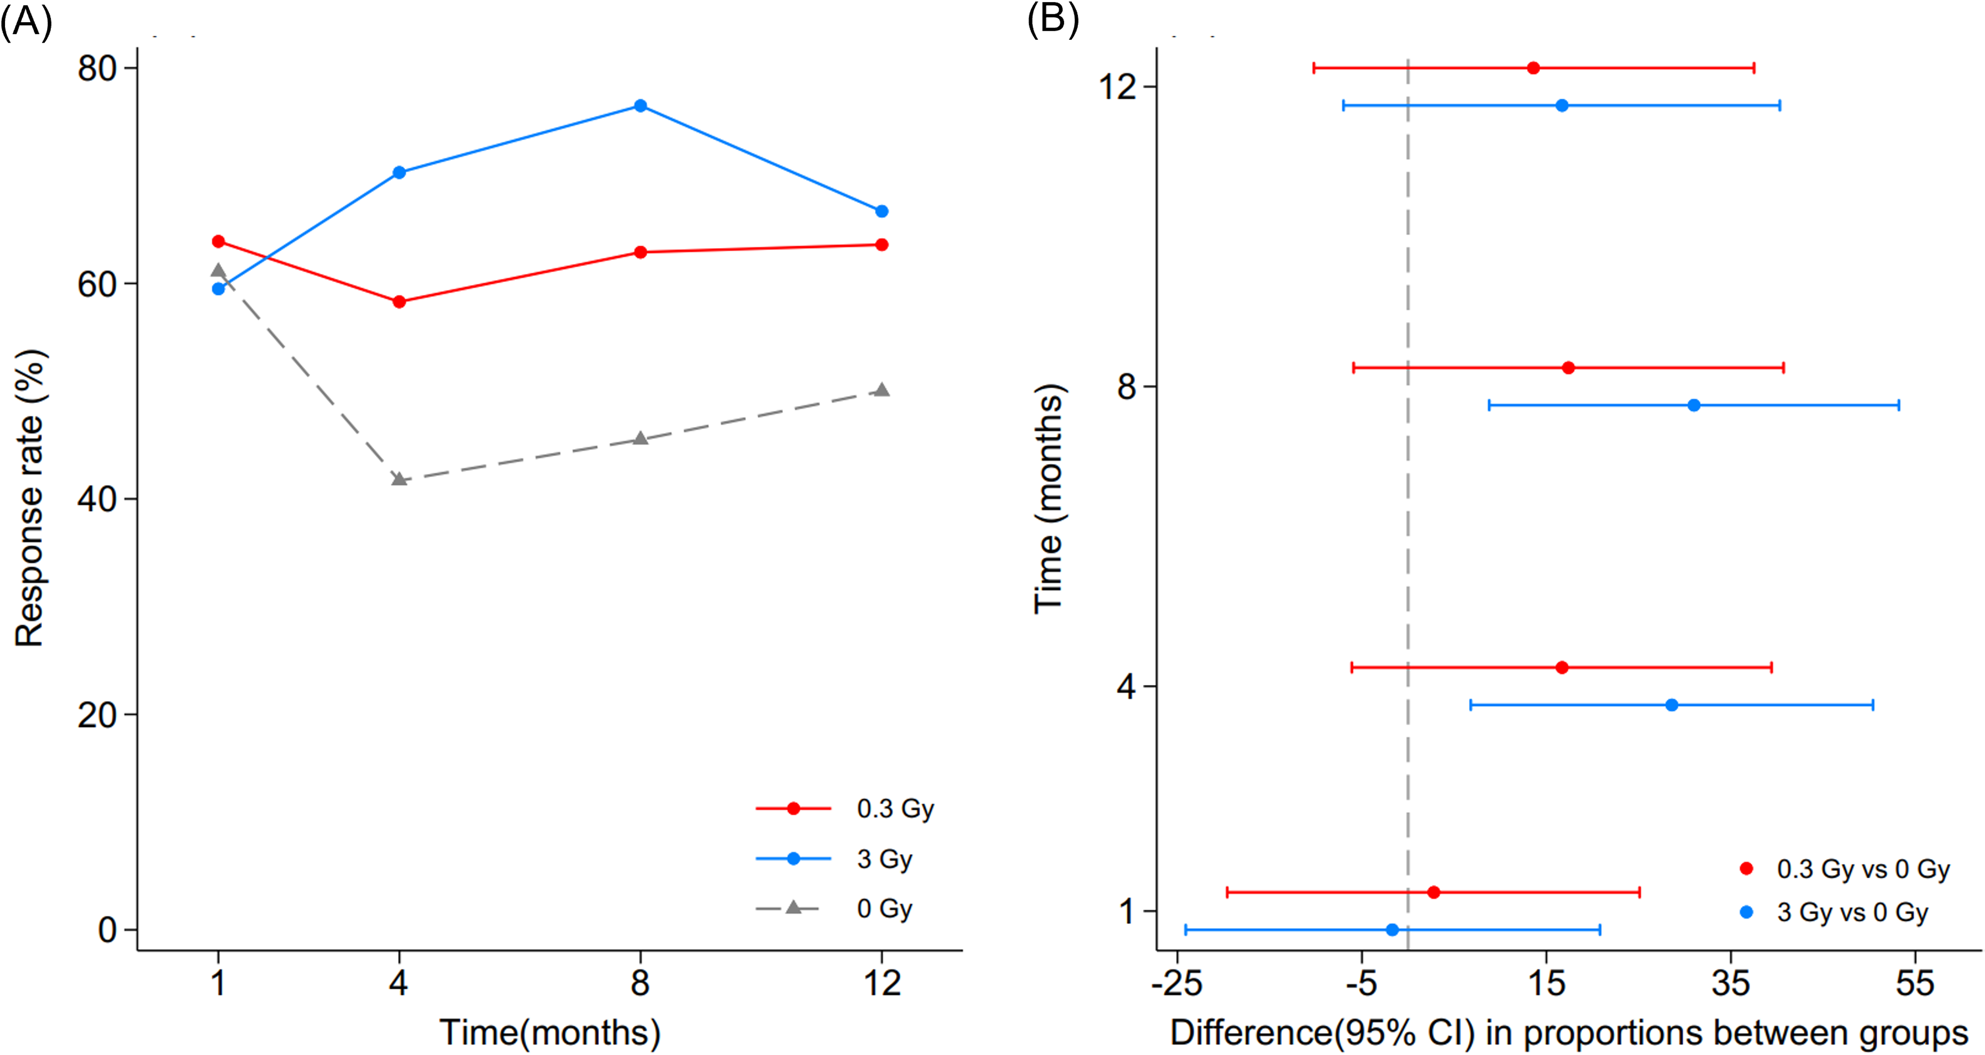
Original responder rates at 1, 4, 8 and 12 months and 95% confidence intervals versus sham; the 3-Gy difference was not significant at 12 months.
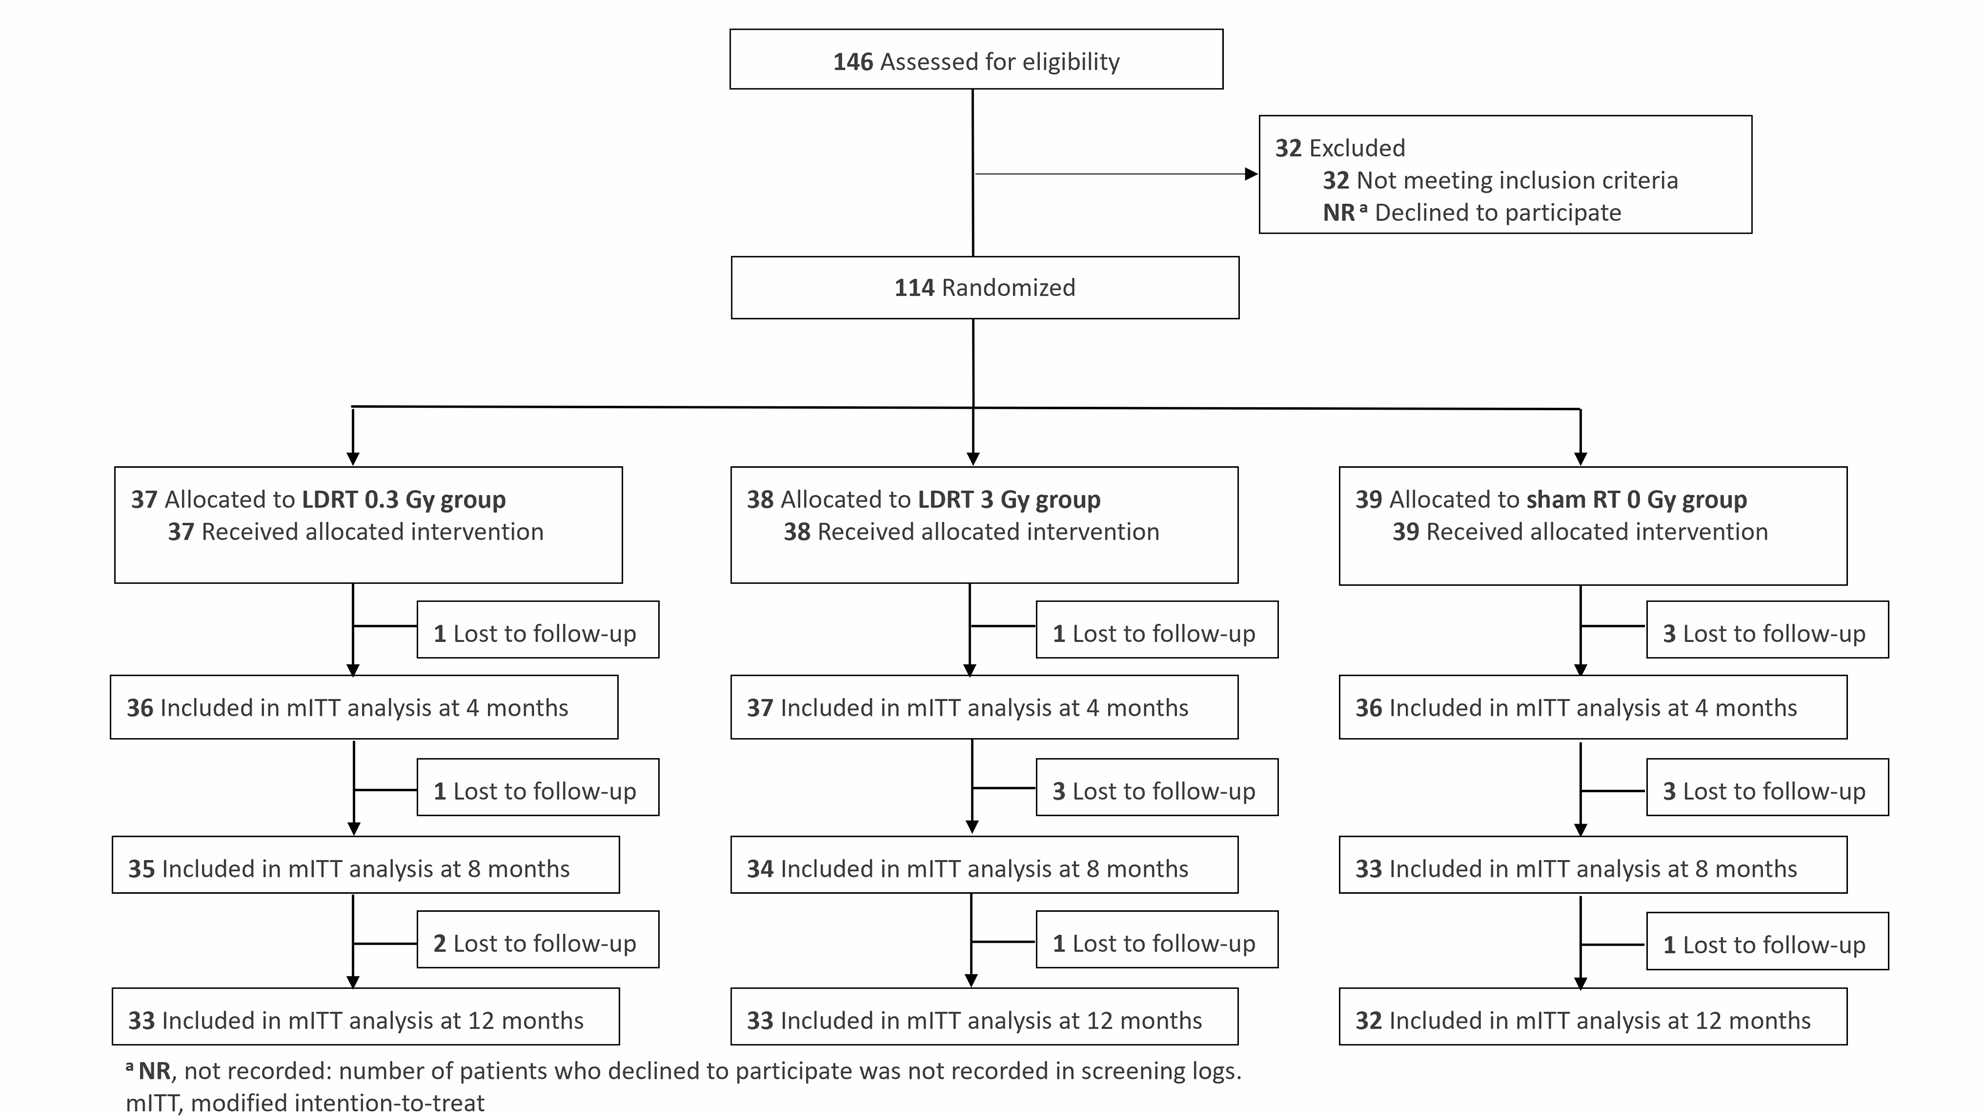
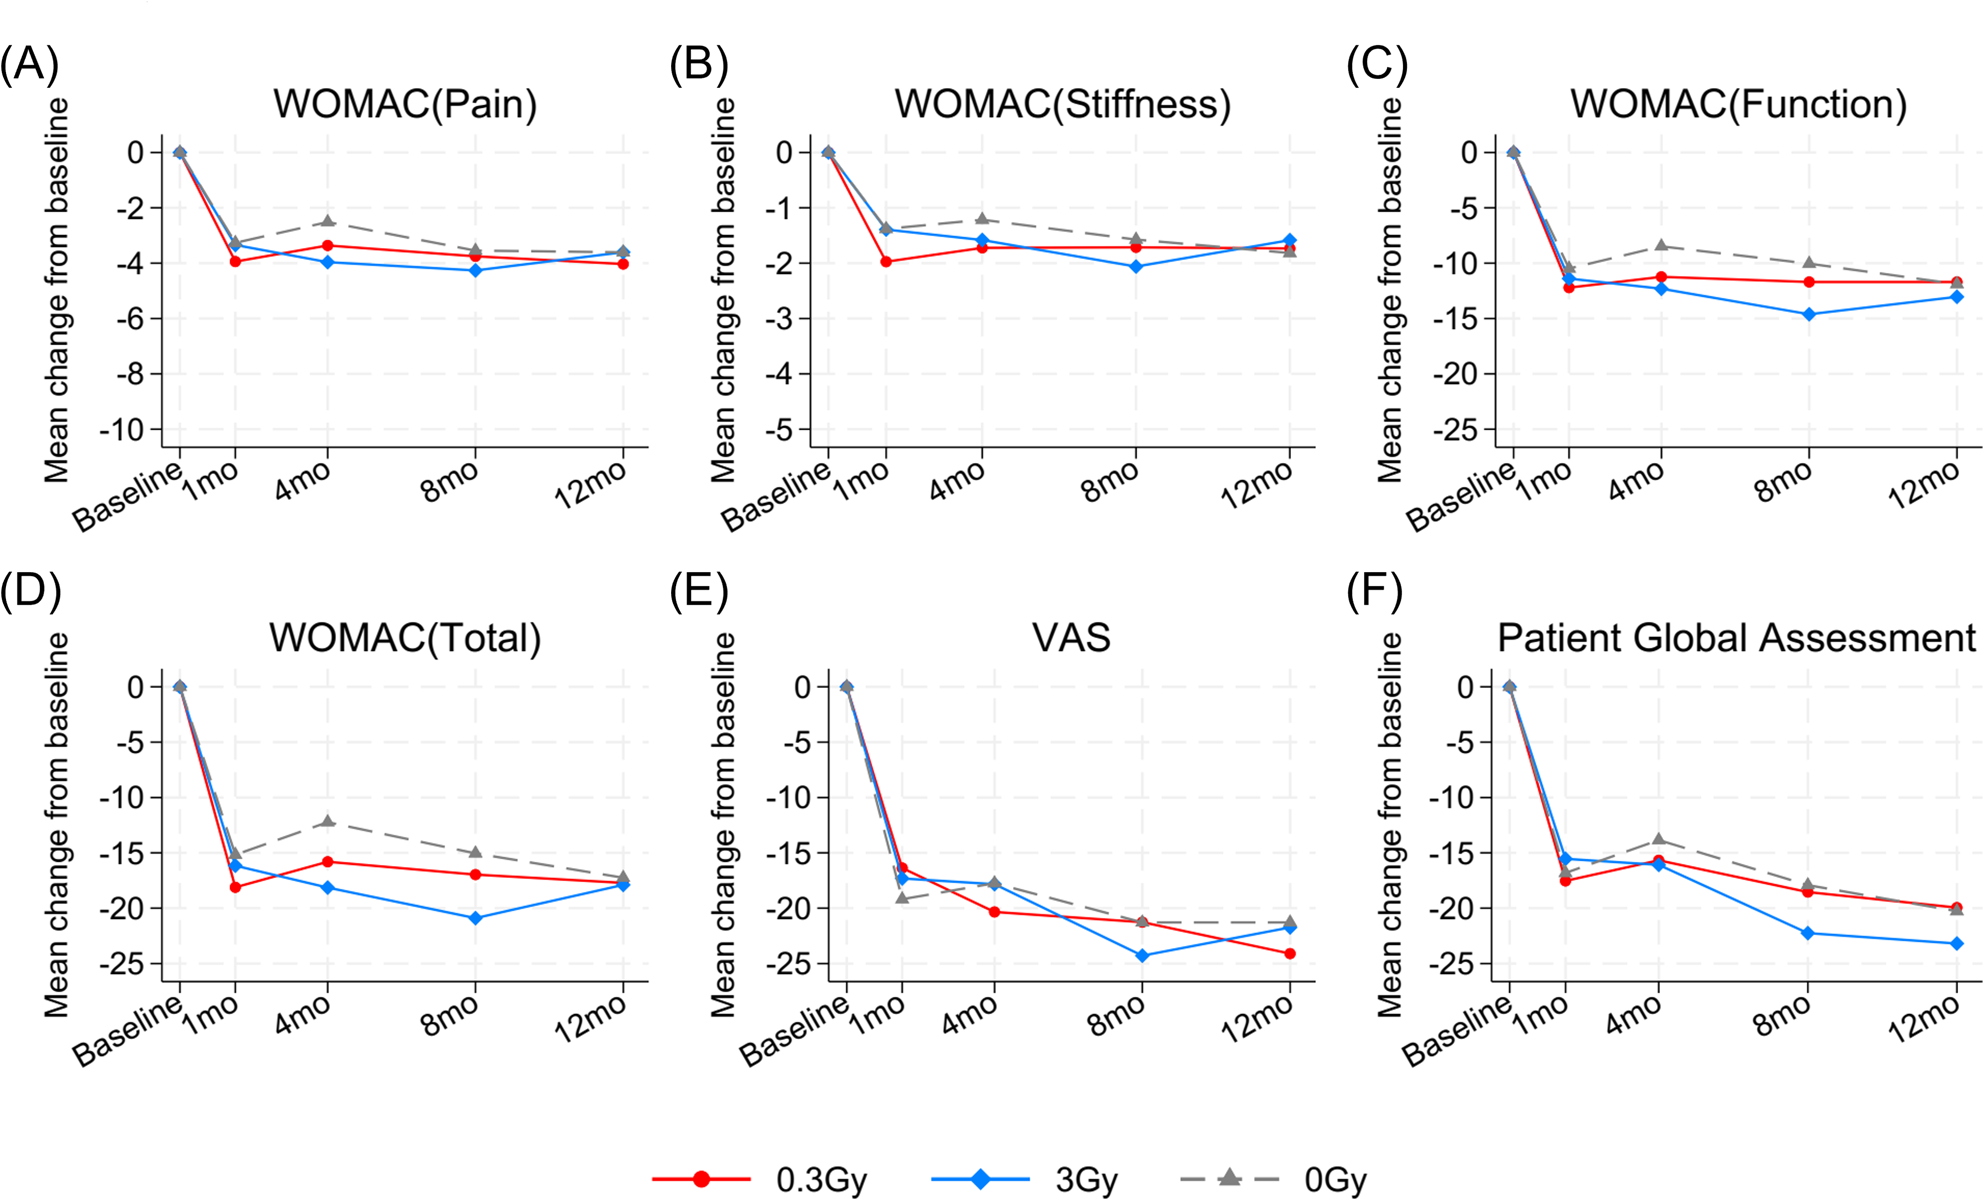
Original CONSORT diagram of allocation and analysis populations.Original WOMAC, VAS and PGA trajectories; continuous secondary outcomes did not show significant between-group differences.
2026-10-02Original figures and charts
knee osteoarthritisrandomized triallow-dose radiotherapy

Can low-dose radiotherapy reduce knee osteoarthritis symptoms?

At four months, responder rates were 70.3% with 3 Gy versus 41.7% with sham (p=0.021); the 0.3-Gy rate was 58.3% (p=0.168 versus sham).

Abstract · Original text

Byoung Hyuck Kim, Du Hyun Ro, Joon Ho Wang, Dae-Hee Lee, Kichul Shin, Min Jung Kim, Tae Woo Kim, Moon Jong Chang, Dong Hyun Kim, Mira Han, Ji Hyun Lee, Ji Hee Kang, Ji Young Kim, Eun-Hee Hong, Seong-Jun Cho, Hyuk-Soo Han, Hak Jae Kim, Won Park. Single course low-dose radiation therapy in knee osteoarthritis (LoRD-KNeA): a randomized controlled trial. BMC Medicine. 2026. doi:10.1186/s12916-026-05287-9.

Excerpt from the original abstract

Low-dose radiotherapy (LDRT) has been used as a non-pharmacological treatment for osteoarthritis (OA), but robust evidence from randomized, sham-controlled trials remains limited.…

Keywords

  • knee osteoarthritis
  • randomized trial
  • low-dose radiotherapy
  • symptom response

© 2026 The Author(s).

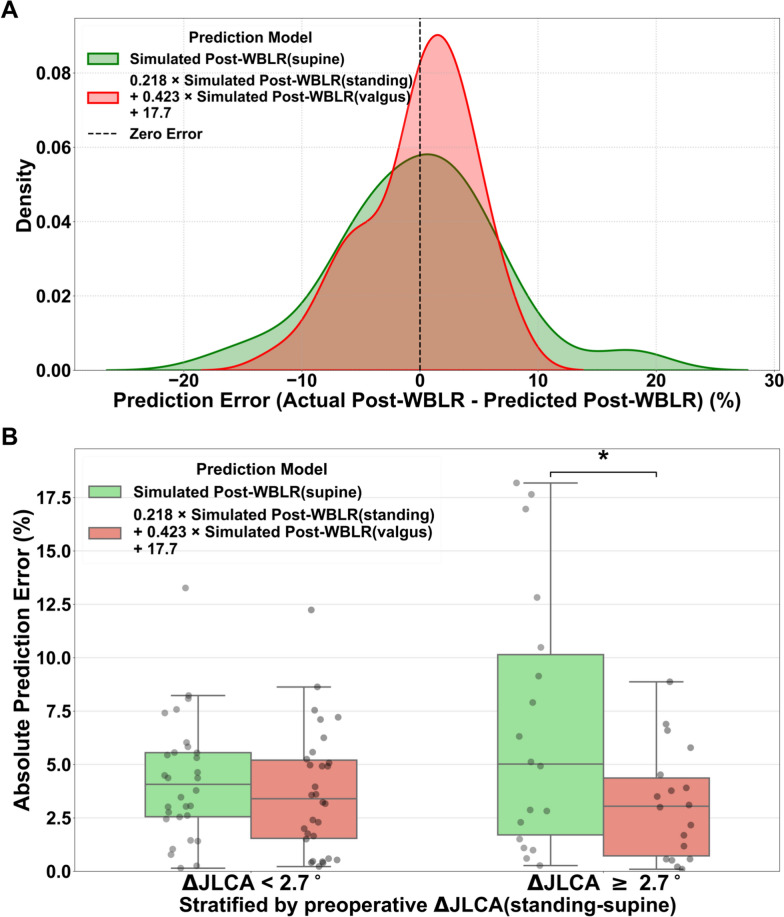
A study chart comparing the predictive bias distribution of the WBLR in dormant posture and complex regression models, and JLCA subgroup bias.
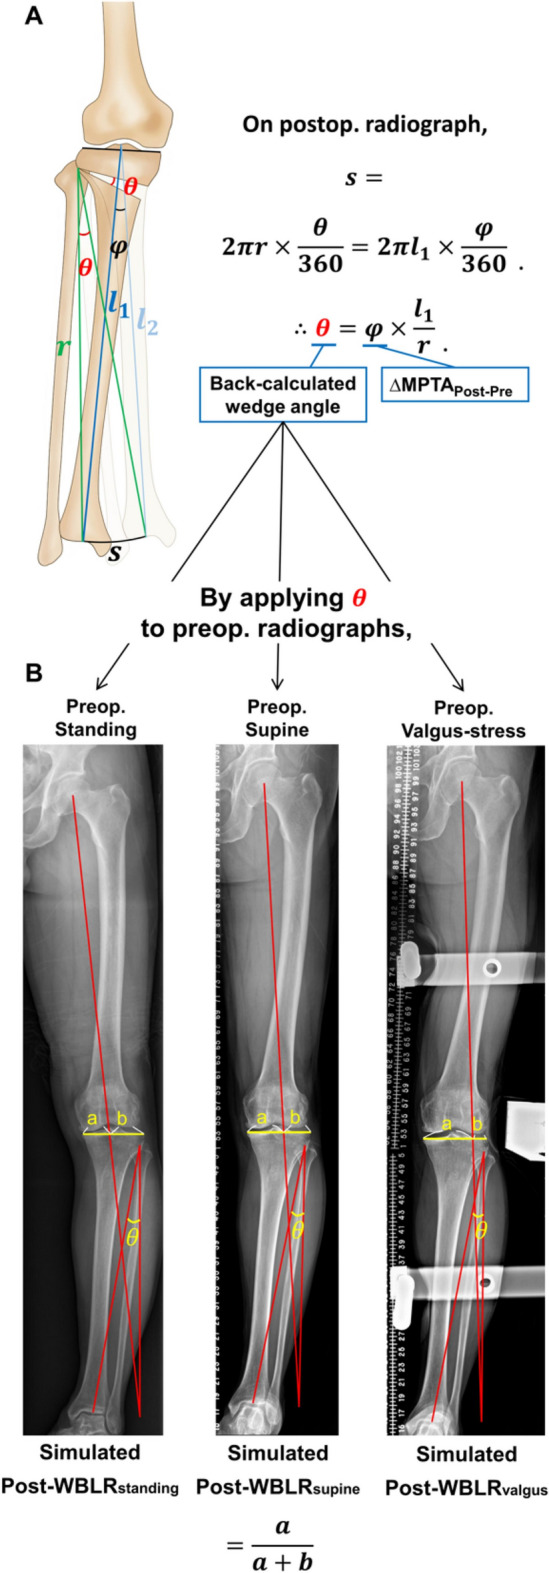
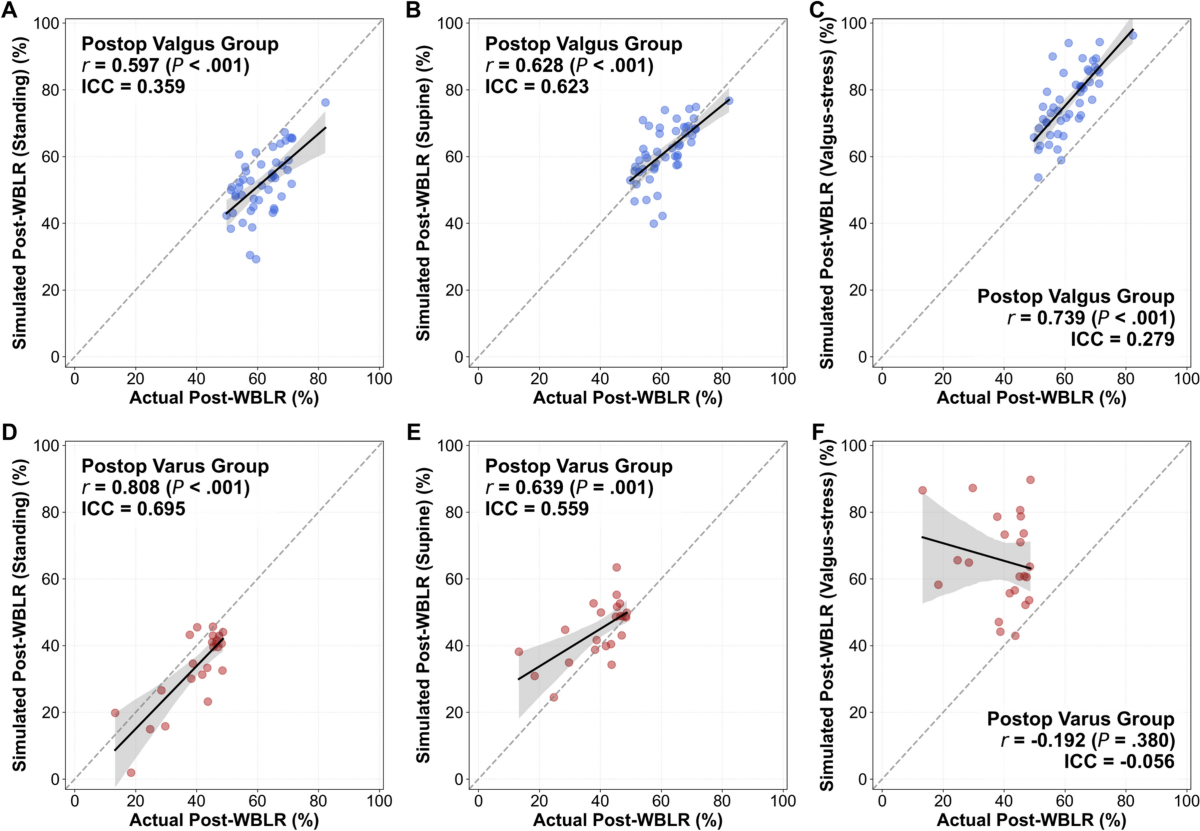
The original surgery plan is also shown showing the reversal of angles corrected and the Miniaci-style WBLR simulationSimulated versus actual postoperative WBLR from standing, supine and valgus-stress images. The upper row shows postoperative valgus and the lower row residual varus; distinguish correlation from agreement.
2026Original figures and charts
HTOalignmentJLCA

Does Adding Information from Other Positions to Supine X-rays Change the Surgical Plan?

In the valgus subgroup, mean error and RMSE were 0.0% ± 6.9% and 6.8% supine, −9.3% ± 7.8% and 12.1% standing, and +15.2% ± 6.7% and 16.6% under valgus stress.

Abstract · Original text

Geunwu Gimm, Hyunjeong Ra, Seok Gyun Yang, Byung Sun Choi, Du Hyun Ro, Hyuk-Soo Han. Complementary roles of standing, supine, and valgus-stress whole-leg radiographs in medial open-wedge high tibial osteotomy planning: supine minimizes bias, whereas standing and valgus-stress reduce outliers. Knee surgery & related research. 2026;38(1):38. doi:10.1186/s43019-026-00340-6.

BACKGROUND

Accurate alignment correction is essential in medial open-wedge high tibial osteotomy (MOWHTO). However, conventional planning based on standing radiographs may not reflect postoperative intra-articular alignment changes. While differences between standing and supine radiographs have been investigated, the role of valgus-stress whole-leg radiographs in preoperative planning remains largely unexplored. This study evaluated the predictive accuracy of standing, supine, and valgus-stress whole-leg radiographs in MOWHTO planning and determined whether integrating these modalities improves alignment prediction compared with single-modality planning.

METHODS

This retrospective study included 71 patients who underwent MOWHTO. Preoperative standing, supine, and valgus-stress whole-leg radiographs, along with 1-year postoperative standing radiographs, were analyzed. To minimize the influence of surgical execution error and allow the analysis to focus on planning error, the achieved wedge angle was back-calculated from postoperative bony correction and reapplied to each preoperative modality to simulate the postoperative weight-bearing line ratio (Post-WBLR). Accuracy was assessed by comparing simulated and actual Post-WBLR. Multivariable regression was performed to identify predictors of actual Post-WBLR and to compare a multimodal model with the best-performing single-modality simulation.

RESULTS

In the postoperative valgus subgroup (n = 48), supine-based simulation showed no significant difference from actual Post-WBLR (mean difference, 0.0% ± 6.9%; root mean square error [RMSE], 6.8%). In contrast, standing-based simulation underestimated alignment (-9.3% ± 7.8%; RMSE, 12.1%), whereas valgus-stress simulation overestimated it (15.2% ± 6.7%; RMSE, 16.6%). A multimodal regression model incorporating simulated Post-WBLR from standing and valgus-stress radiographs demonstrated significantly improved predictive accuracy compared with the supine-only simulation (R2, 0.606 versus 0.080; RMSE, 4.5% versus 6.8%). Notably, in patients with a preoperative standing-to-supine joint line convergence angle difference (∆JLCAstanding-supine) ≥ 2.7°, the multimodal model significantly reduced prediction errors (absolute error: 3.2% versus 6.8%; RMSE: 4.0% versus 9.0%; all P < 0.015).

CONCLUSIONS

Supine radiographs generally provided the most accurate single-modality basis for MOWHTO planning. Standing and valgus-stress radiographs offered complementary information, and their integration improved prediction accuracy and reduced planning outliers. While further validation is required, a stepwise planning workflow-using supine radiographs as the default modality and multimodal integration when ∆JLCAstanding-supine ≥ 2.7°-may serve as an exploratory framework for reducing the risk of planning-related under- or overcorrection.

Keywords

  • High tibial osteotomy
  • Preoperative planning
  • Standing
  • Supine
  • Valgus-stress
  • Whole-leg radiograph
  • HTO
  • alignment

© The Author(s) 2026

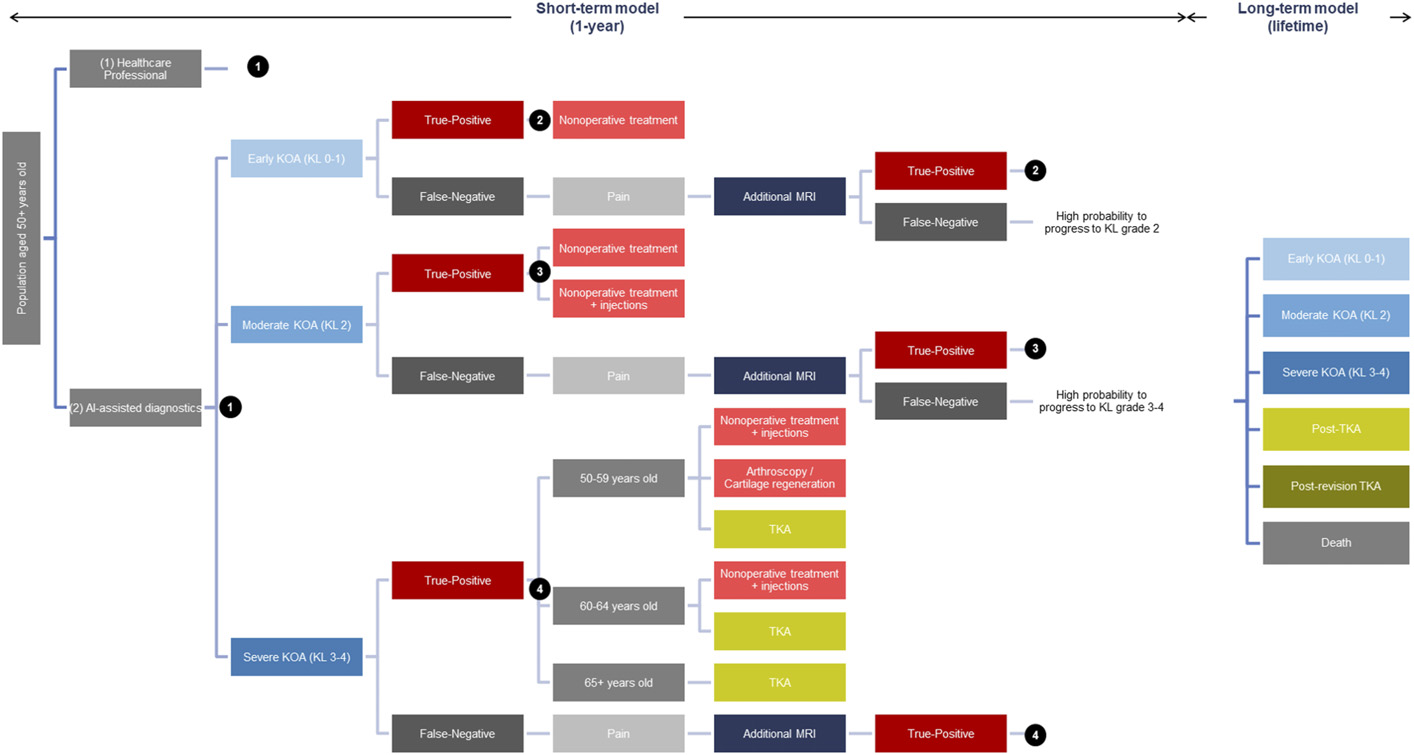
Original Figure 1: Treatment pathways and lifetime progression model after AI grading
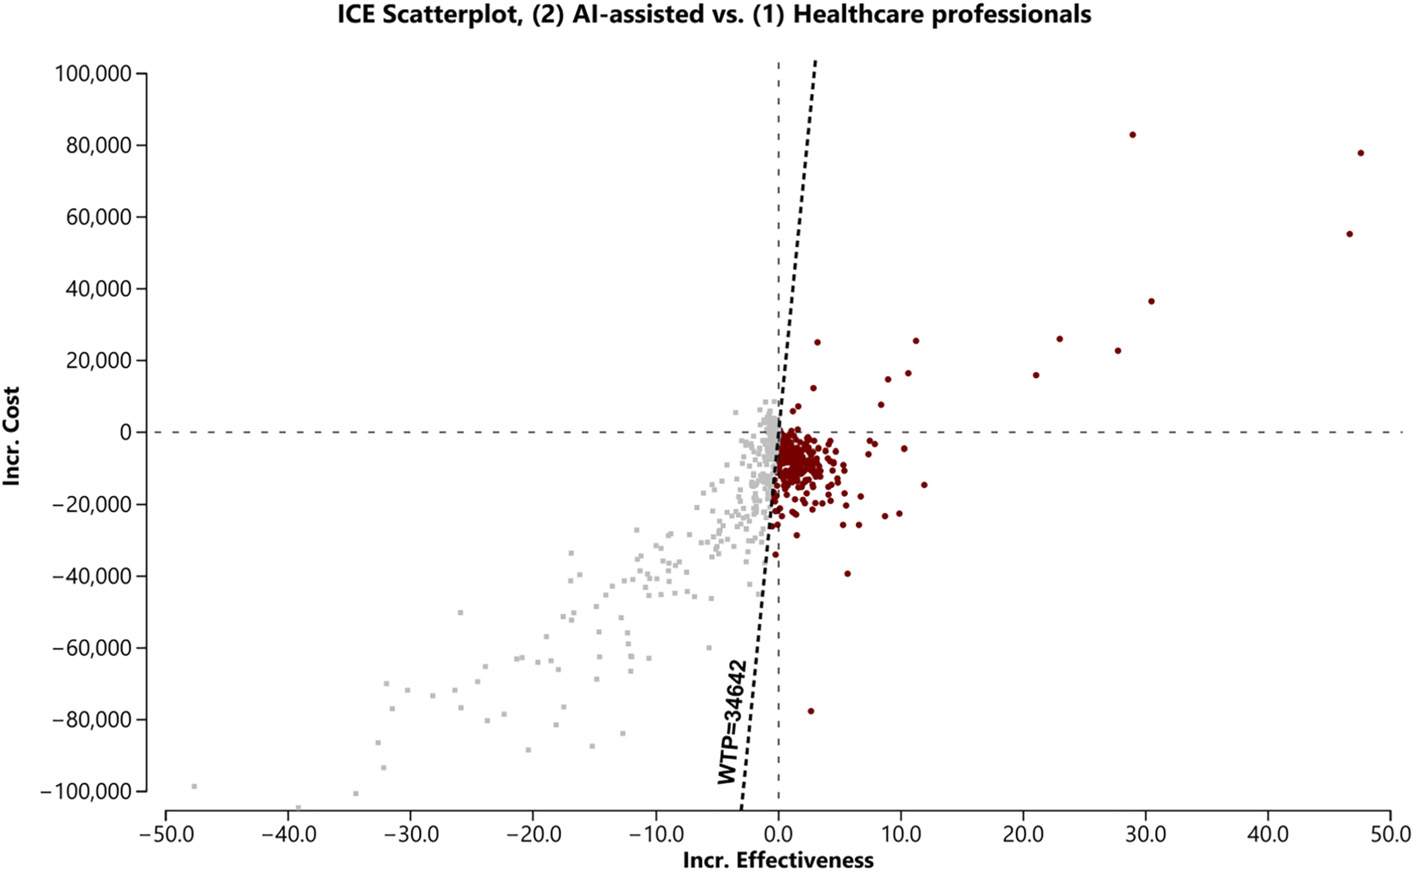
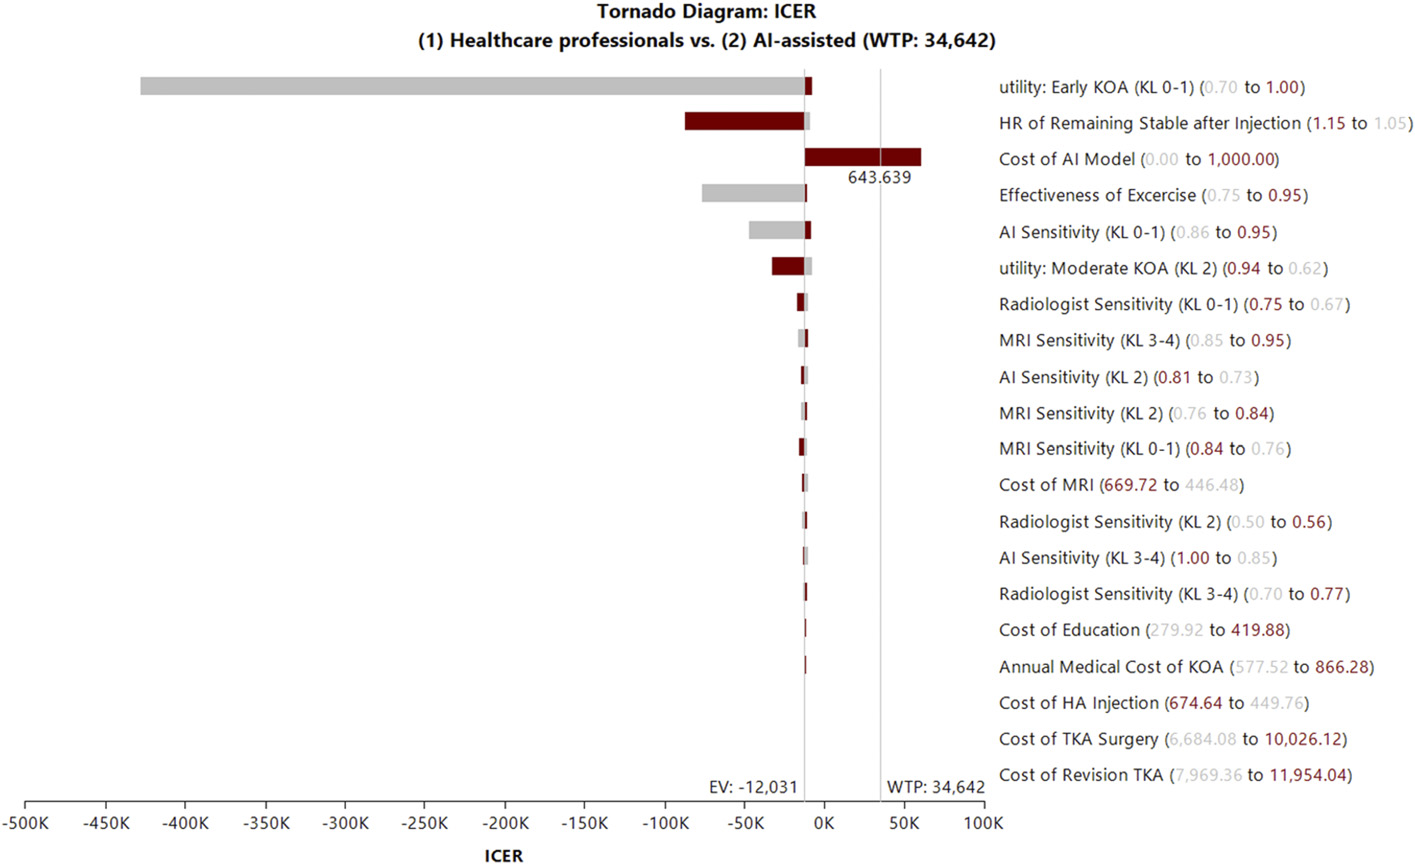
Original Figure 4: Model uncertainty: probabilistic sensitivity analysisOriginal Figure 2: Which assumptions change cost-effectiveness?
2026Original figures and charts
AIKLhealth economics

What Is the Lifetime Cost-effectiveness of AI-assisted KL Grading in the Korean Healthcare System?

Estimated lifetime cost and QALYs were $137,710 and 22.721 for the AI strategy, versus $140,834 and 22.461 for conventional assessment. The paper reported a $3,125 cost reduction, a 0.260 QALY gain and an ICER of −$12,031/QALY.

Abstract · Original text

KyungYi Kim, Sang Yoon Kim, Sung Sik Kim, Jae Hun Kim, Du Hyun Ro, Byung Sun Choi. Cost-Effectiveness of AI-Assisted Kellgren-Lawrence Grading of Knee Osteoarthritis in the South Korean Health-Care System. The Journal of bone and joint surgery. American volume. 2026. doi:10.2106/JBJS.25.01278.

Excerpt from the original abstract

Early diagnosis of knee osteoarthritis (KOA) is often delayed due to reliance on subjective interpretation of radiographs. Recent advances in artificial intelligence (AI)-based automated Kellgren-Lawrence…

Keywords

  • Kellgren–Lawrence grading
  • Artificial intelligence
  • Knee osteoarthritis
  • Cost-effectiveness
  • South Korea
  • AI
  • KL
  • health economics
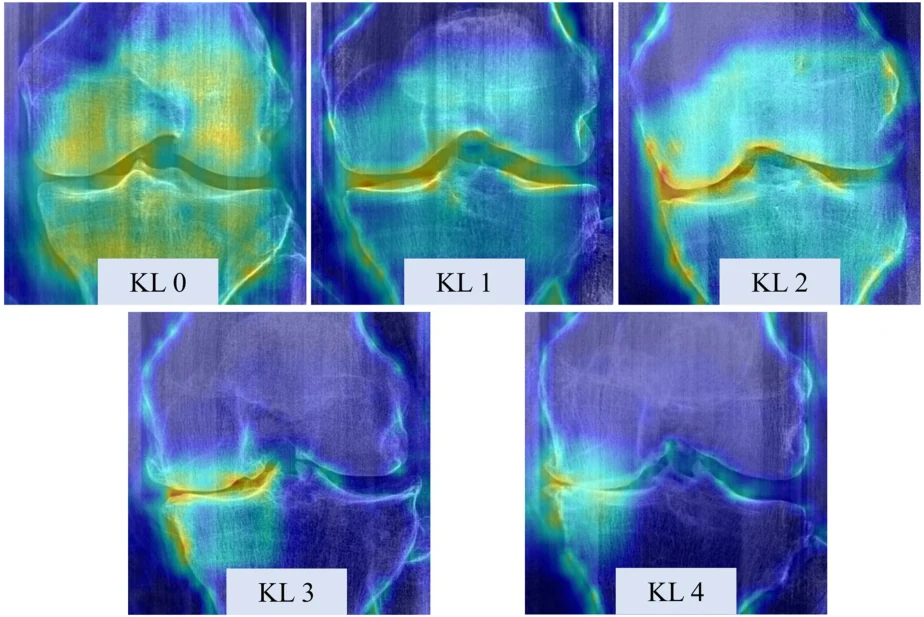
A diagram linking osteophytes and joint-space narrowing to KL grades.
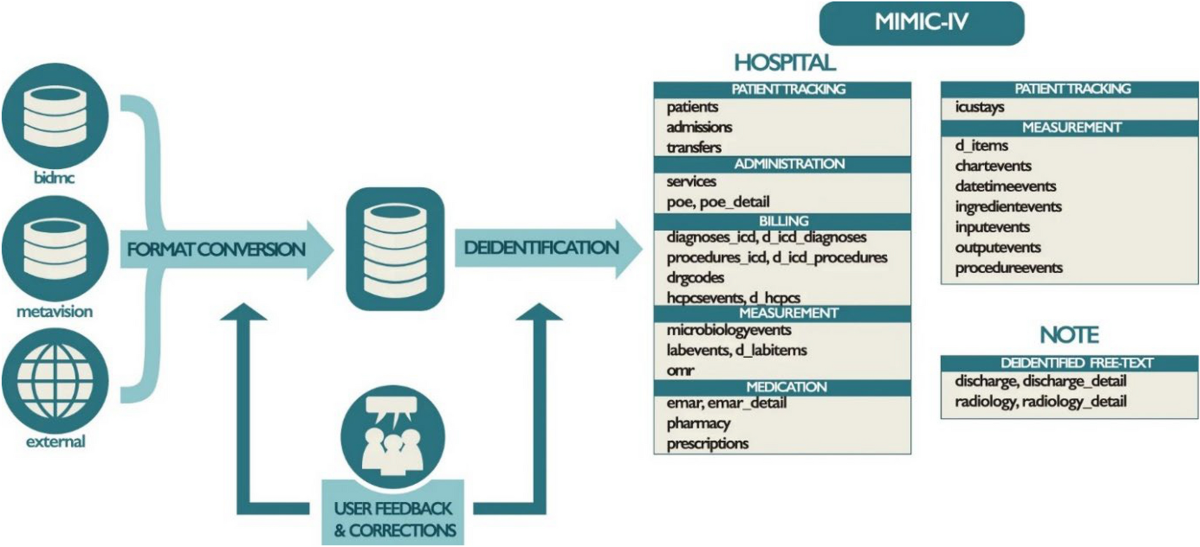
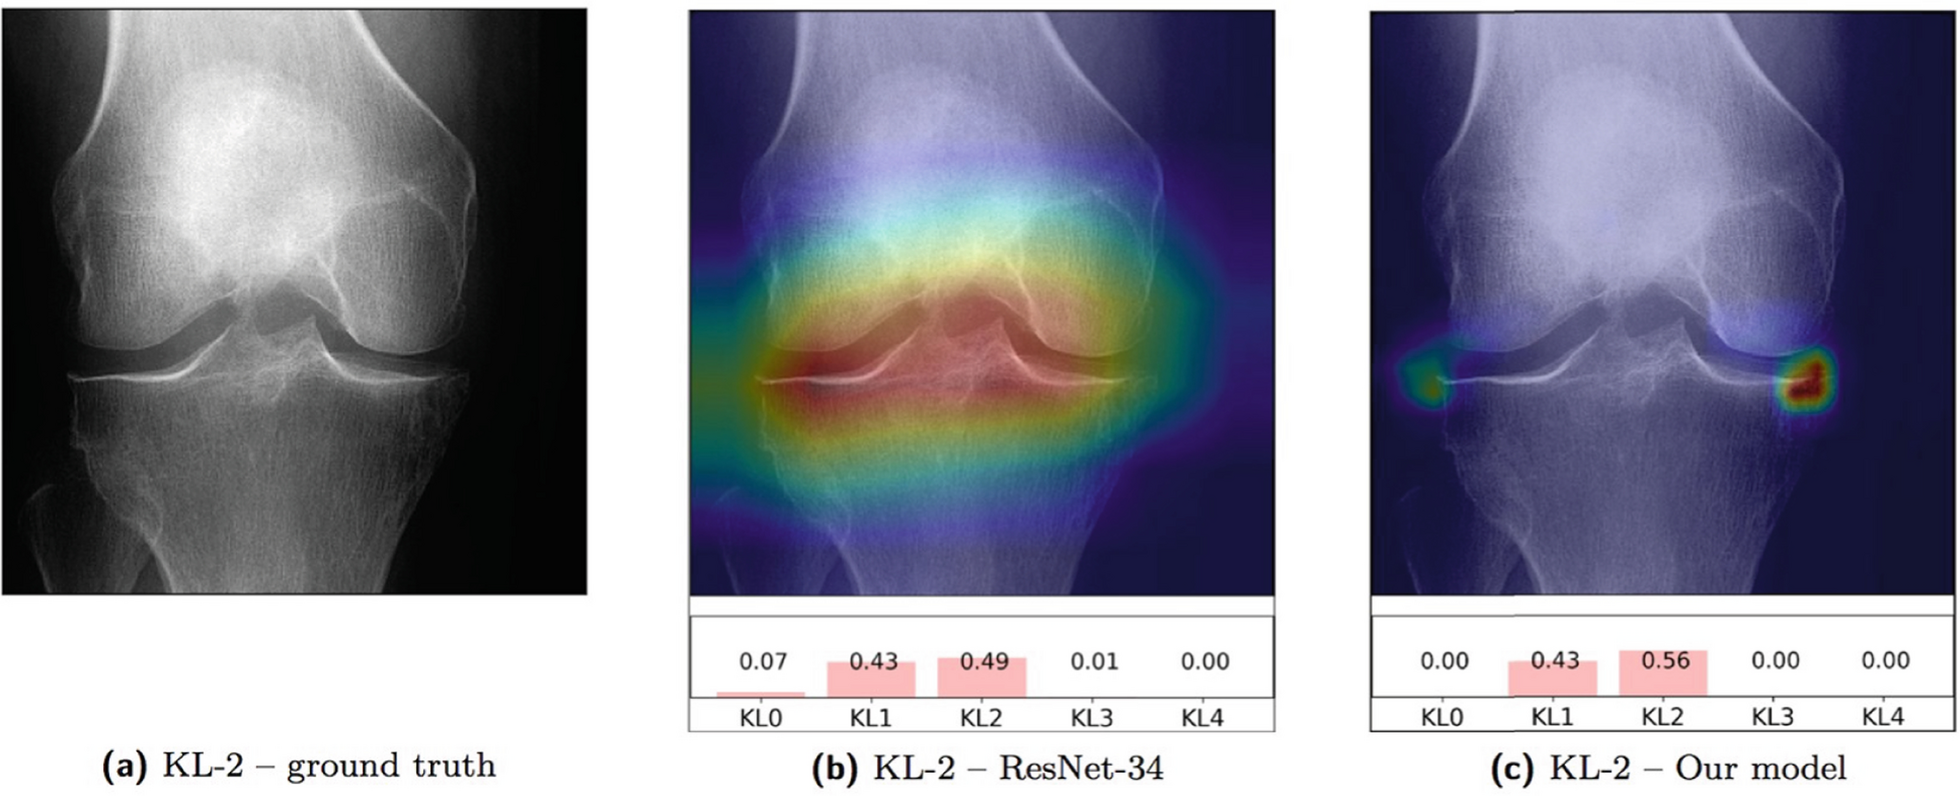
MIMIC-IV links hospital, intensive care and clinical-document data.The figure shows an X-ray, saliency map and KL grade probabilities together.
2026Original figures and charts
AIexternal validationclinical translation

What Limits the Clinical Adoption of Orthopedic AI, and What Validation Is Needed?

This narrative review compares perioperative risk prediction, fracture and OA imaging, and LLM support for documentation and communication. It examines the validation and operational steps needed to turn model accuracy into clinical benefit.

Abstract · Original text

Sang Yoon Kim, Byung Sun Choi, Hyuk-Soo Han, Du Hyun Ro. Artificial intelligence in orthopedics: current applications, challenges, and future directions. Knee surgery & related research. 2026;38(1):14. doi:10.1186/s43019-026-00317-5.

BACKGROUND

Artificial intelligence research in orthopedics has grown rapidly, yet a substantial gap remains between technical development and clinical translation. This narrative review summarizes current applications of artificial intelligence in orthopedic practice and highlights barriers to implementation.

MAIN BODY

Current work converges on three domains: machine learning for structured perioperative risk prediction, deep learning for standardized musculoskeletal imaging, and large language models for workflow and decision support. Applications such as automated fracture detection, Kellgren-Lawrence grading for osteoarthritis, and transfusion risk modeling are approaching clinical maturity. However, routine adoption is limited by algorithmic opacity, performance degradation in new clinical environments, and poor fit within existing workflows. We argue that progress should shift from increasing model complexity toward rigorous evaluation, including external validation on independent cohorts. In addition, probability calibration and uncertainty estimation are important for trustworthy risk communication. Future directions may include multimodal "digital twin" approaches that integrate electronic medical records, imaging phenotypes, and intraoperative data into patient-specific trajectories.

CONCLUSIONS

The clinical impact of artificial intelligence in orthopedics will depend on life-cycle governance and demonstrated net benefit, prioritizing reliability and implementation science over retrospective benchmark performance.

Keywords

  • Artificial intelligence
  • Clinical translation
  • Deep learning
  • External validation
  • Large language models
  • Machine learning
  • Musculoskeletal imaging
  • Orthopedics

© The Author(s) 2026

2026Explanatory illustration
TKAalignmentCPAK

As OA Severity Increases, Do the Actual and Arithmetically Estimated Native Joint Lines Change in the Same Way?

In medial OA, TJLA changed from medial-downward to medial-upward at KL 3. TJLA changes were observed at KL 3–4 in both medial and lateral OA (P < 0.001).

Abstract · Original text

John E Farey, Benjamin J Leong, Jil A Wood, Do W Lee, Seyun Kim, Darren B Chen, Du H Ro, Samuel J MacDessi. Dynamic changes to the tibiofemoral joint line with increasing osteoarthritis severity and its relationship to constitutional alignment : a radiological analysis of 3,320 knees. Bone & joint open. 2026;7(2):249-258. doi:10.1302/2633-1462.72.BJO-2025-0370.R1.

AIMS

Changes in both native and dynamic joint line obliquity may influence the pathogenesis of osteoarthritis (OA) and subsequent development of coronal limb alignment deformity. This study aimed to characterize joint line alterations relative to OA severity and constitutional alignment.

METHODS

A retrospective, cross-sectional analysis of 3,320 preoperative weightbearing long-leg radiographs from patients undergoing total knee arthroplasty was performed using deep learning software. OA severity was assessed using the Kellgren-Lawrence (KL) grading system. Constitutional alignment parameters included lateral distal femoral angle (LDFA), medial proximal tibial angle (MPTA), arithmetic hip-knee-ankle (aHKA) angle, and arithmetic joint line obliquity (aJLO). Tibiofemoral joint line alterations were assessed using the mechanical hip-knee-ankle (mHKA) angle, tibial joint line angle (TJLA), femoral joint line angle (FJLA), and joint line congruence angle (JLCA). The primary outcome was the difference in the TJLA relative to the aJLO across KL grades, stratified for the presence of medial or lateral compartment OA.

RESULTS

Alterations in TJLA were observed in moderate (KL Grade 3) and severe (Grade 4) OA for medial and lateral compartment OA (both p < 0.001). In medial OA, the TJLA reversed orientation at Grade 3 from medially declined to medially inclined relative to aJLO. The aJLO maintained its constitutional orientation until Grade 4, when non-clinically significant changes (< 1°) were observed (p < 0.001). In lateral OA, the TJLA became more medially inclined in moderate and severe OA, while the aJLO remained stable. Significant changes in aHKA were observed in moderate and severe OA, indicating an apparent change in constitutional limb alignment (p < 0.001 for both medial and lateral OA).

CONCLUSION

The tibiofemoral joint line angle changes dynamically with OA progression, while the constitutional aJLO remains stable until advanced disease occurs. Understanding this distinction between constitutional and dynamic joint line orientation is important when communicating and studying outcomes related to knee alignment.

Keywords

  • Tibiofemoral joint line
  • Osteoarthritis severity
  • Constitutional alignment
  • Radiological analysis
  • TKA
  • alignment
  • CPAK
  • aJLO

© 2026 Farey et al.

2026Original figures and charts
posterior tibial slopeHTOACL

Can Changing the Radiographic Angle Change the Measurement of the Same Knee?

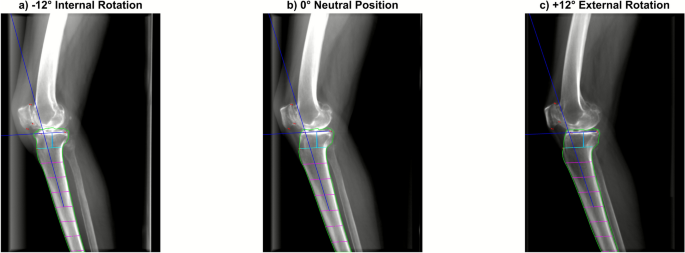
The ICC between AI and expert measurements was 0.78 (95% CI 0.73–0.82). PTS increased by approximately 0.2° per 1° of internal rotation (R² = 0.43).

Abstract · Original text

Jaeseok Park, Andreas Persson, R Kyle Martin, Eivind Inderhaug, Sung Eun Kim, Sangyoon Kim, Donghyuk Kwak, Du Hyun Ro. Effects of axial malrotation on posterior tibial slope measurement: a digitally reconstructed radiograph study enabling automated quality assessment. Knee surgery & related research. 2026;38(1):3. doi:10.1186/s43019-026-00303-x.

BACKGROUND

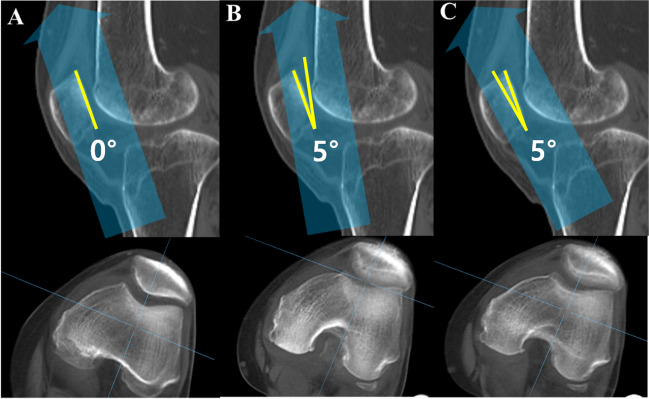
Accurate measurement of posterior tibial slope (PTS) is highly sensitive to axial malrotation of the knee during acquisition, but its impact has not been systematically quantified across different anatomical variations. This simulation study aimed to quantify the effect of axial malrotation on PTS using digitally reconstructed radiographs (DRRs) and suggest a practical marker for filtering out low-quality images with excessive malrotation.

MATERIALS AND METHODS

A total of 55 preoperative computed tomography (CT) scans from January 2021 to December 2024 in a single, tertiary hospital were retrospectively reviewed. DRRs were generated from those scans to simulate lateral knee radiographs with malrotation ranging from -12° to +12° relative to an anatomically aligned baseline. An artificial-intelligence (AI)-based tool automatically measured PTS on each DRR, with agreement evaluated using intraclass correlation coefficient (ICC). PCDR was calculated from femoral contours and analyzed for correlation with malrotation angles and resulting PTS measurement error.

RESULTS

AI-based PTS measurements on DRRs showed good agreement with expert annotations (ICC = 0.78, 95% CI 0.73-0.82). PTS increased linearly with internal rotation, with each 1° of rotation resulting in approximately 0.2° change in PTS (R2 = 0.43, p < 0.01). Errors exceeded 1° when malrotation surpassed ±6°. PCDR was strongly correlated with malrotation angle (R2 > 0.98, p < 0.001) and achieved fair discriminative performance as a binary classifier for > 1° PTS error [area under the receiver operating curve (AUROC) = 0.77].

CONCLUSIONS

CT-derived DRRs combined with AI analysis showed that PTS measurement error proportionately increased with axial malrotation. Identifying and excluding radiographs with excessive rotation improves the reliability of slope-based assessments and supports more accurate surgical planning.

LEVEL OF EVIDENCE

III, retrospective cohort study.

Keywords

  • Artificial intelligence
  • Axial malrotation
  • Digitally reconstructed radiograph
  • Lateral knee radiograph
  • Posterior tibial slope
  • posterior tibial slope
  • HTO
  • ACL

© The Author(s) 2026

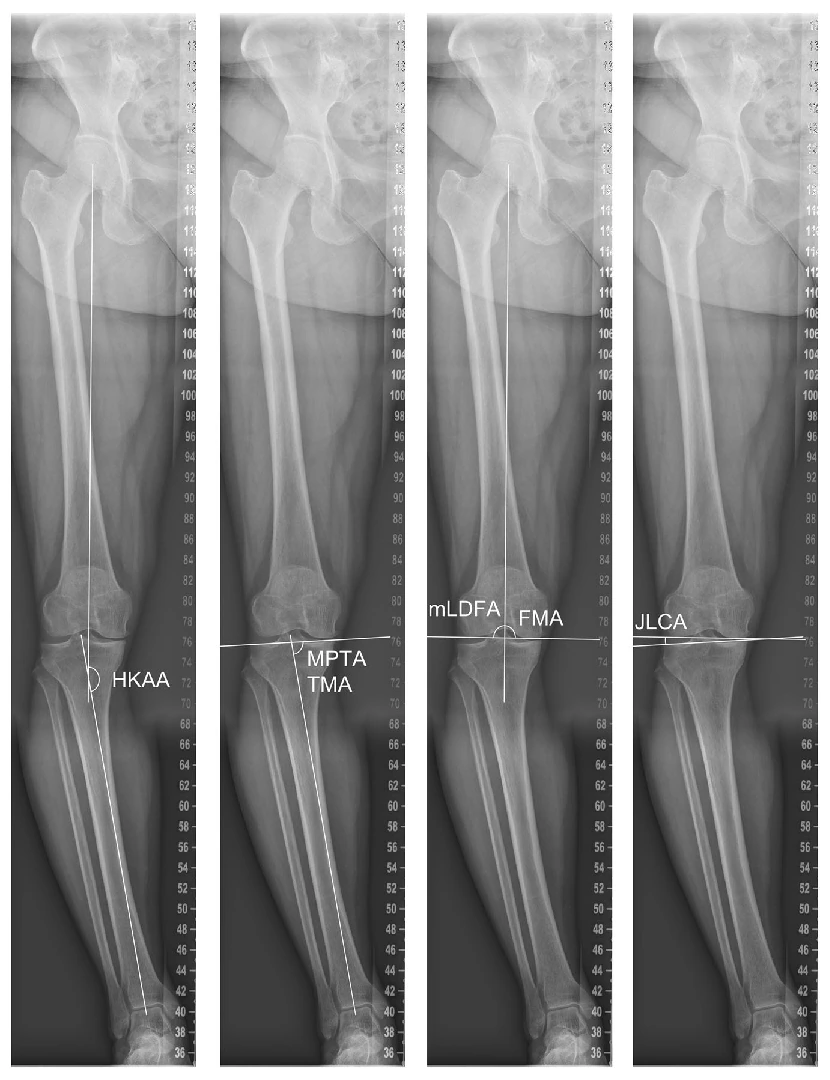
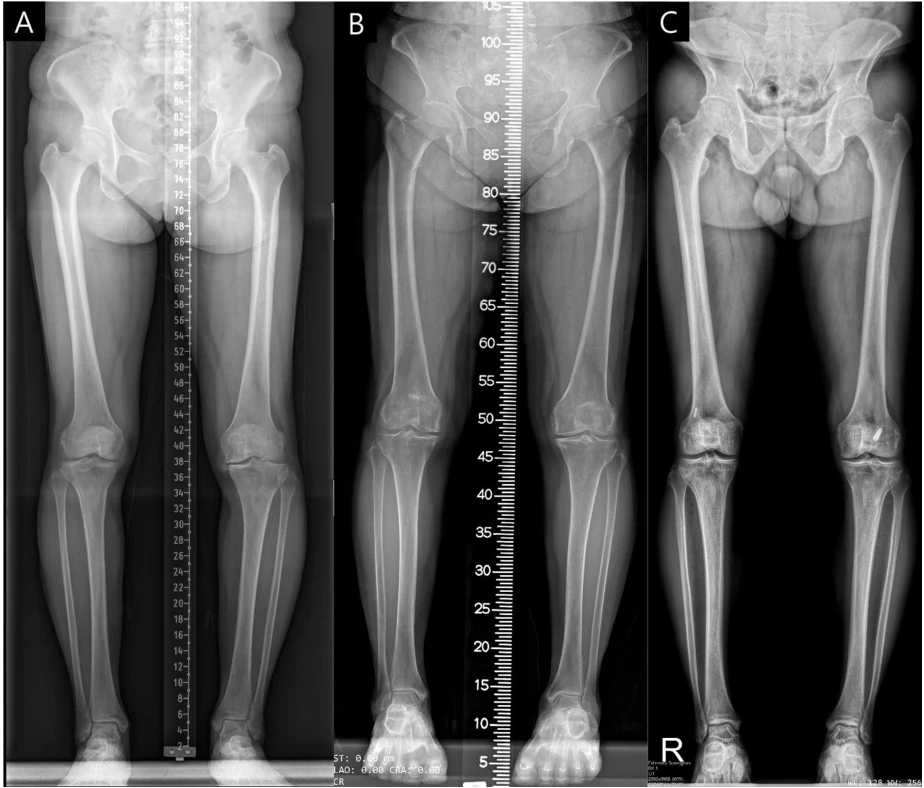
Original standing long-leg radiographs illustrate alignment measurements, including the whole-leg axis and joint line.
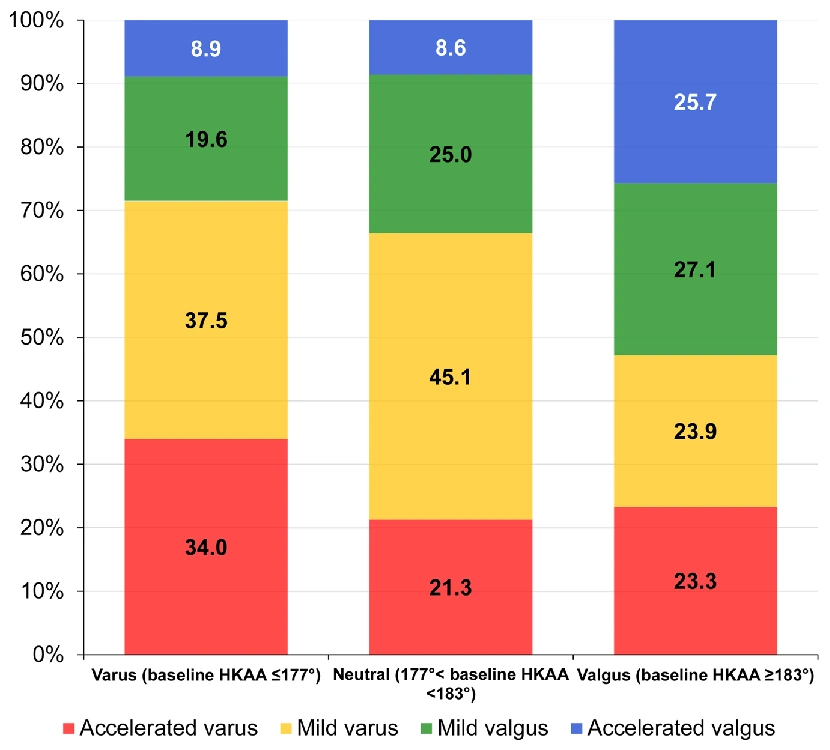
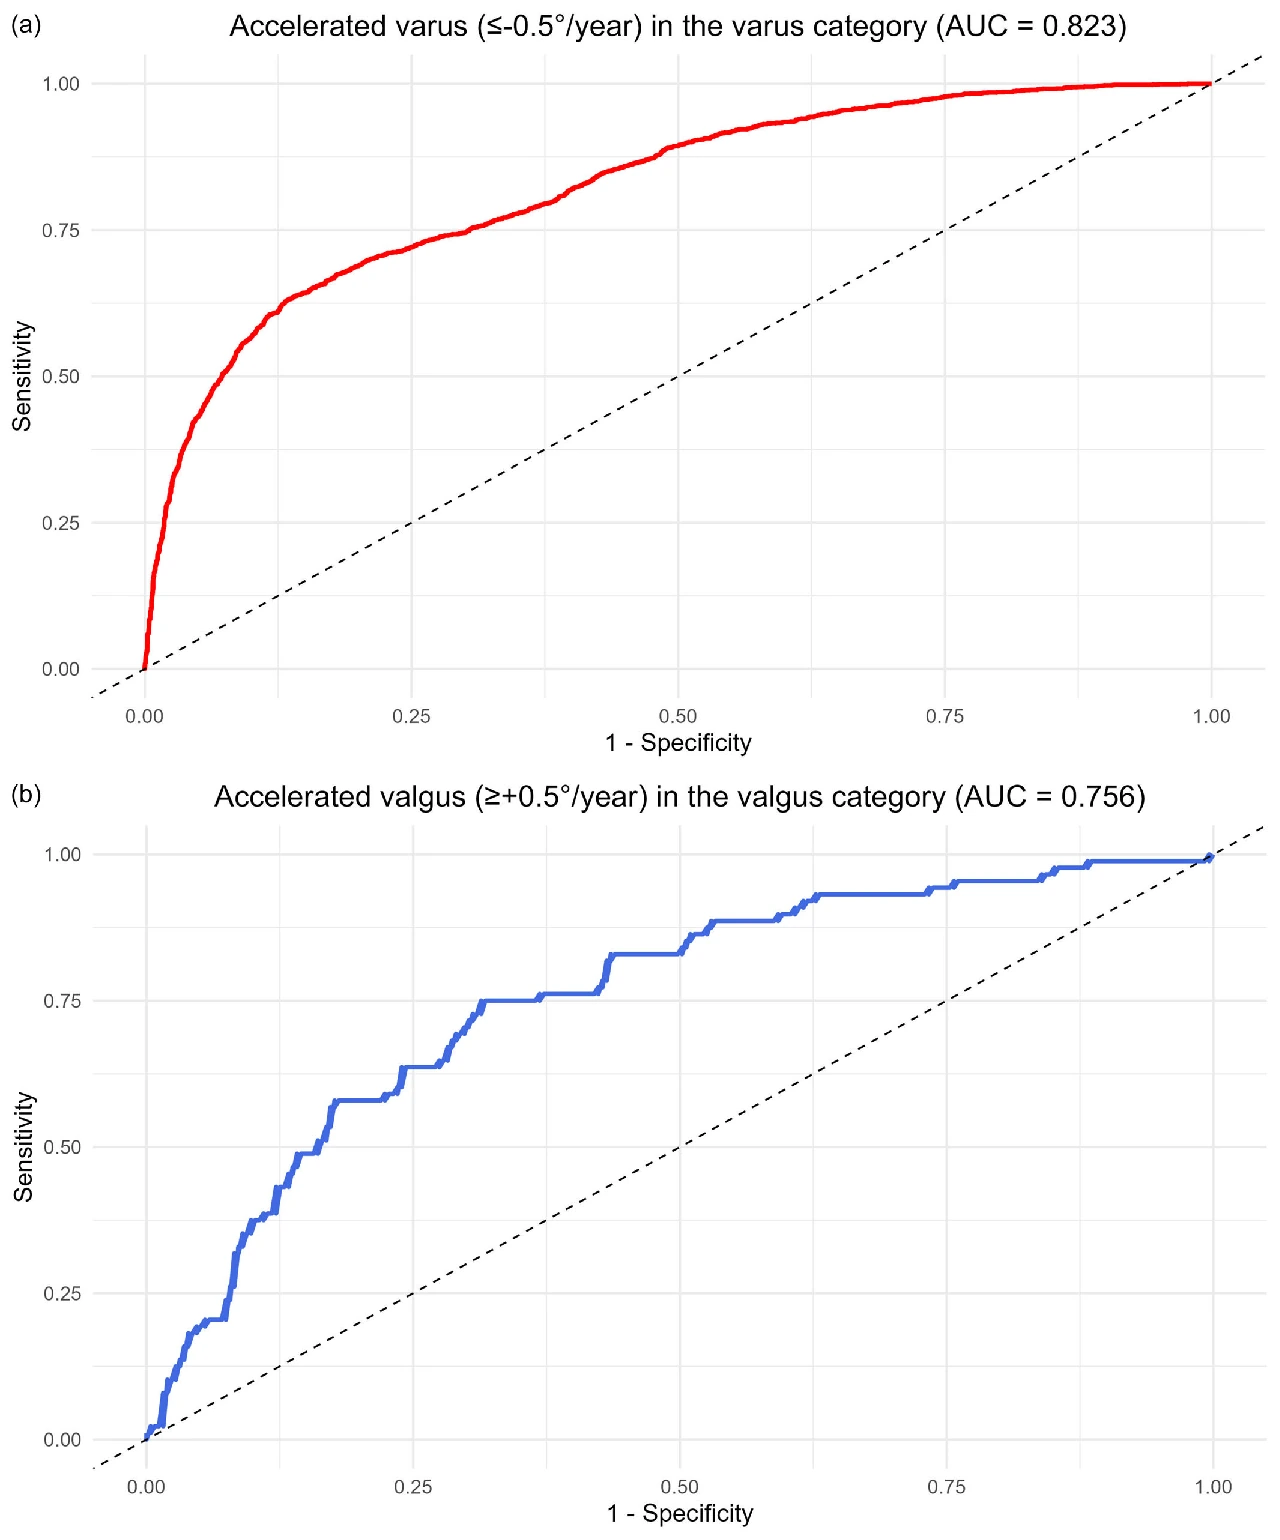
The original graph separates progression direction and rate by baseline alignment. Annual progression of at least 0.50° in the same direction occurred in 34.0% of the varus group and 25.7% of the valgus group.ROC curves for rapid varus and valgus progression, with AUCs of 0.823 and 0.756, respectively.
2026Original figures and charts
alignmentJLCAOA progression

JLCA and coronal alignment progression: a longitudinal analysis of 10,841 knees

Rapid varus progression occurred in 34.0% (95% CI 32.8–35.1%), and rapid valgus progression in 25.7% (95% CI 21.2–30.7%).

Abstract · Original text

Kee Soo Kang, Sang Yoon Kim, Byung Sun Choi, Hyuk-Soo Han, Chong Bum Chang, Du Hyun Ro. Large joint line convergence angle is associated with accelerated coronal alignment progression in osteoarthritic knees: A longitudinal analysis of 10,841 knees. Knee surgery, sports traumatology, arthroscopy : official journal of the ESSKA. 2026. doi:10.1002/ksa.70293.

PURPOSE

Coronal knee alignment, determined by both joint line orientation and morphology of femur and tibia, alters with osteoarthritic progression, but its rate of change has not been systematically evaluated. This study aimed to categorise limbs according to the rate of hip-knee-ankle angle (HKAA) alteration and identify factors associated with accelerated alignment progression.

METHODS

10,841 limbs from a tertiary hospital were analysed. Alignment parameters and Kellgren-Lawrence (K-L) grades were measured on standing long-leg radiographs. Limbs were grouped by baseline HKAA as varus (HKAA ≤ 177°), neutral (177° < HKAA < 183°), or valgus (HKAA ≥ 183°). Accelerated and mild progression were defined as ≥ 0.50°/year and < 0.50°/year, respectively. Factors associated with accelerated coronal alignment progression were analysed using multivariable logistic regression.

RESULTS

Accelerated varus and valgus progression occurred in 34.0% (95% CI: 32.8%-35.1%) of the varus and 25.7% (21.2%-30.7%) of the valgus category, respectively. After adjustment for age, sex, and body mass index, greater baseline varus alignment, medial proximal tibial angle, and joint line convergence angle (JLCA) were associated with increased odds of accelerated varus progression by 4.9% (4.8%-5.0%), 10.8% (10.6%-10.9%), and 12.9% (12.7%-13.1%), respectively, in the varus category (n = 6519; AUC = 0.823). Higher K-L grade was associated with increased risk of accelerated varus progression compared with Grade 0 (I: 44.8% [44.5%-45.0%], II: 88.9% [88.6%-89.2%], III: 391.8% [346.1%-443.5%], and IV: 378.0% [305.0%-468.5%]; all p < 0.001). In the valgus category (n = 343), greater baseline HKAA and medially-opened JLCA increased the risk of accelerated valgus progression by 17.4% (3.6%-33.5%) and 19.4% (9.2%-28.8%), respectively (AUC = 0.756).

CONCLUSIONS

Approximately one-third of limbs with baseline HKAA ≤ 177° and about one-quarter of those with HKAA ≥ 183° exhibited ≥0.50° progression toward varus and valgus, respectively. Accelerated alignment change was associated with greater baseline HKAA, JLCA and higher baseline K-L grade, suggesting characteristics of this potential phenotype.

LEVEL OF EVIDENCE

Level III.

Keywords

  • coronal alignment
  • functional knee phenotypes
  • hip‐knee‐ankle angle
  • joint line convergence angle
  • knee osteoarthritis
  • alignment
  • JLCA
  • OA progression
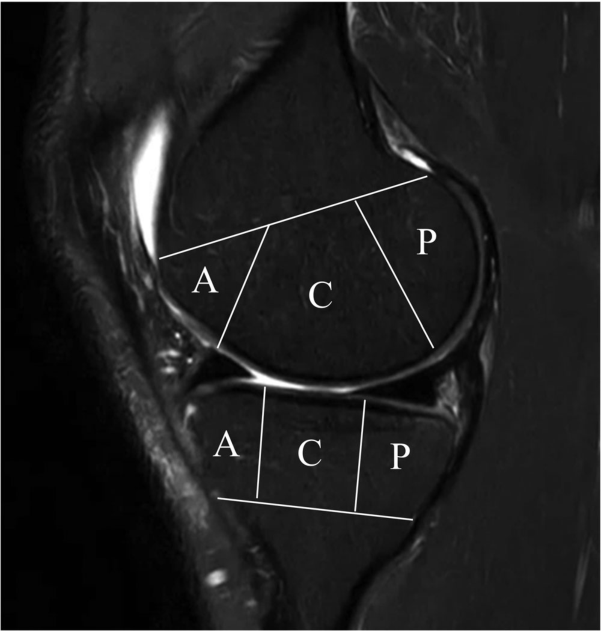
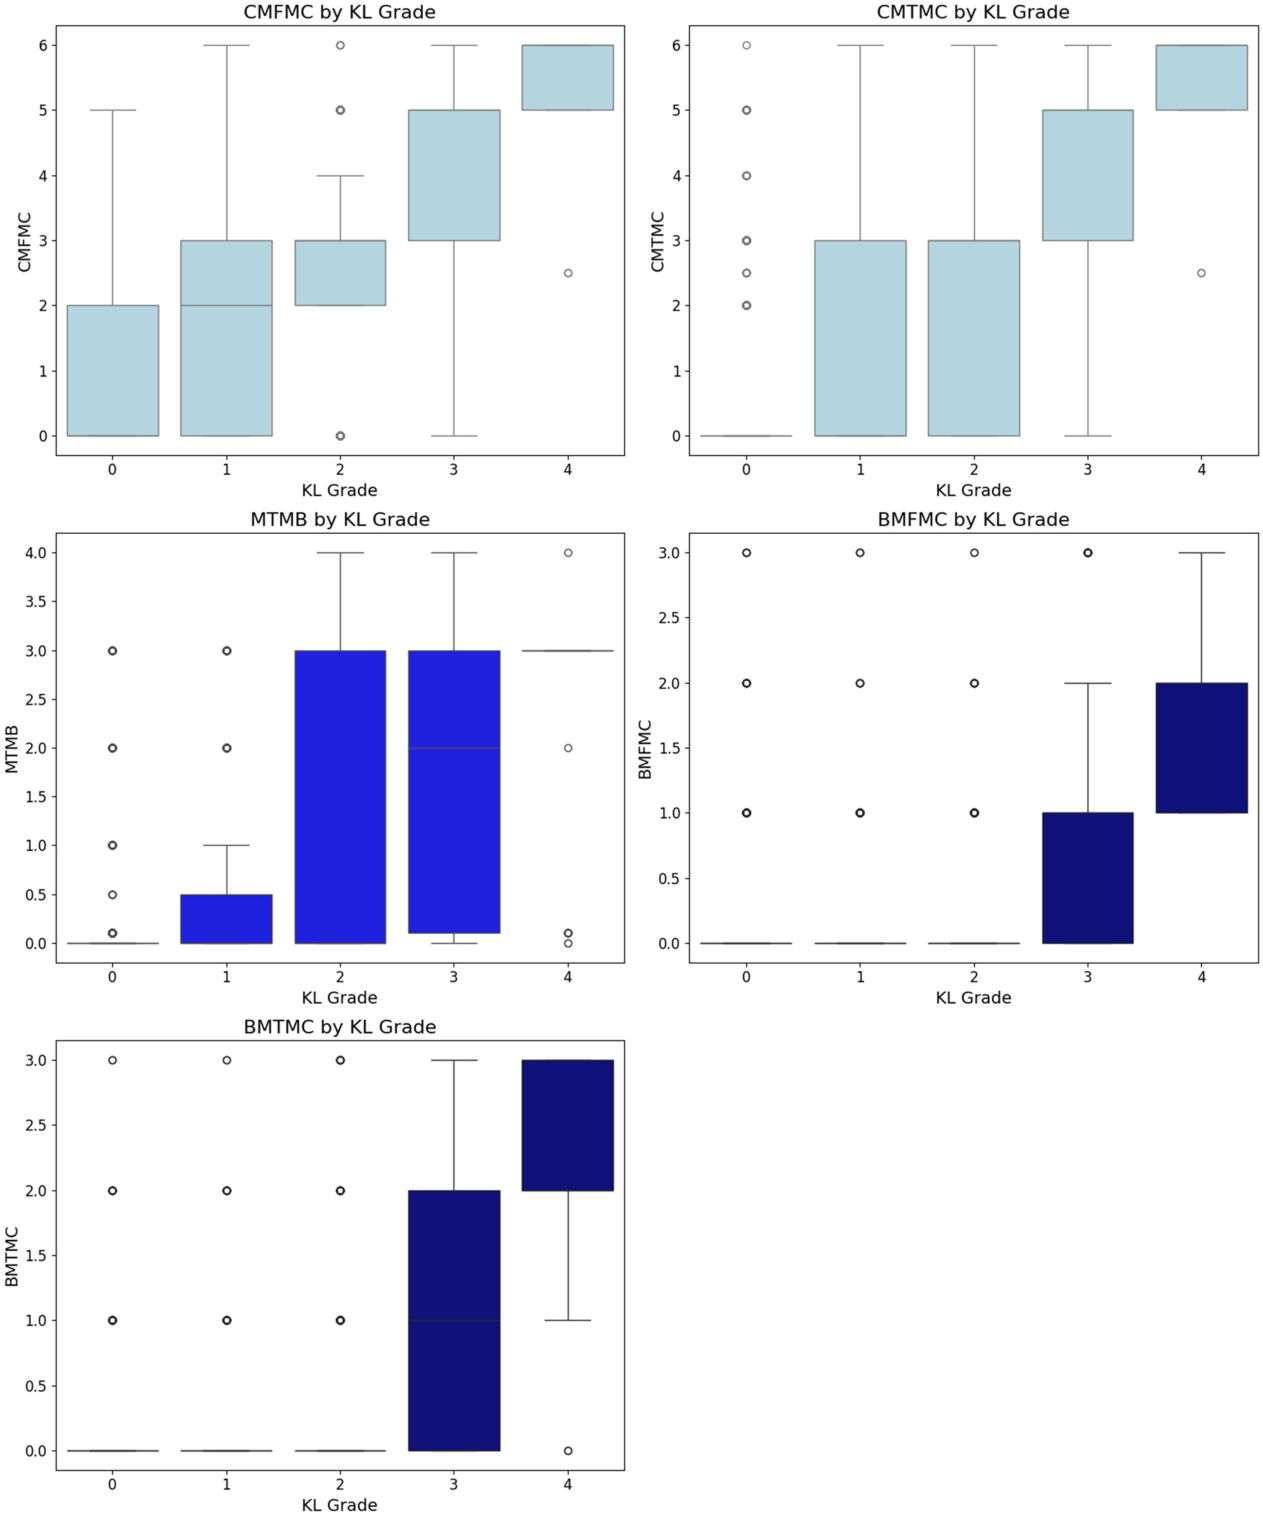
In an MRI, you divide the cartilage and cranial bone in front of A; in the middle of C; behind P. The same knee can vary the amount of tissue change depending on location, so we've broken down the layout.
2026Original figures and charts
OA progressionMRImeniscus

How Are Radiographic OA Changes Related Over Time to Cartilage, Meniscal, and Bone Changes on MRI?

Centrally, meniscal and bone changes followed cartilage damage; posteriorly, meniscal changes appeared first. Central femoral cartilage loss was observed even at KL 0.

Abstract · Original text

Do Weon Lee, Ji-Sahn Kim, Hyuk-Soo Han, Du Hyun Ro. Longitudinal correlation between X-ray and MRI findings in medial compartment knee osteoarthritis: Insights into early cartilage loss and structural changes. Knee surgery, sports traumatology, arthroscopy : official journal of the ESSKA. 2026;34(6):2047-2056. doi:10.1002/ksa.70016.

PURPOSE

Knee osteoarthritis (OA) is a common joint disorder assessed using radiographic (X-ray) and magnetic resonance imaging (MRI). While X-rays are accessible, MRI provides detailed insights into meniscus and cartilage. Few studies have evaluated the correlation between X-ray and MRI findings in knee OA longitudinally. This study addresses this gap by investigating their relationship over time.

METHODS

The Multicenter Osteoarthritis Study (MOST) dataset, a public, longitudinal cohort study focusing on knee OA in older adults, was used. The analysis included 3710 knees with medial compartment OA from different follow-ups over the course of 7 years. X-ray findings were compared with MRI findings, encompassing cartilage, meniscal and bone pathologies.

RESULTS

In the central compartment, knee OA progression began with cartilage loss, followed by meniscal and bone pathology, while in the posterior compartment, meniscal changes preceded cartilage and bone lesions. Cartilage loss in the central femur was the earliest event, even in Kellgren-Lawrence grade 0 knees, preceding X-ray changes. Tibial osteophytes developed first on X-ray, followed by joint space narrowing and femoral osteophytes. Longitudinal regression identified meniscal extrusion, cartilage loss and meniscal tear as significant predictors of OA progression (p < 0.001), with meniscal extrusion being the strongest.

CONCLUSION

Knee OA progression differs by compartment, with cartilage loss initiating changes centrally and meniscal pathology leading posteriorly. Tibial osteophytes appear early on X-ray. Meniscal extrusion is the strongest predictor of OA progression, highlighting the importance of MRI in identifying early changes and guiding personalised management.

LEVEL OF EVIDENCE

Level II.

Keywords

  • cartilage
  • knee
  • magnetic resonance imaging
  • osteoarthritis
  • radiography
  • Osteoarthritis, Knee
  • Magnetic Resonance Imaging
  • Cartilage, Articular

© 2025 The Author(s). Knee Surgery, Sports Traumatology, Arthroscopy published by John Wiley & Sons Ltd on behalf of European Society of Sports Traumatology, Knee Surgery and Arthroscopy.

2026Explanatory illustration
AIMRIvision-language models

How Do We Evaluate AI That Locates and Explains Findings on MRI?

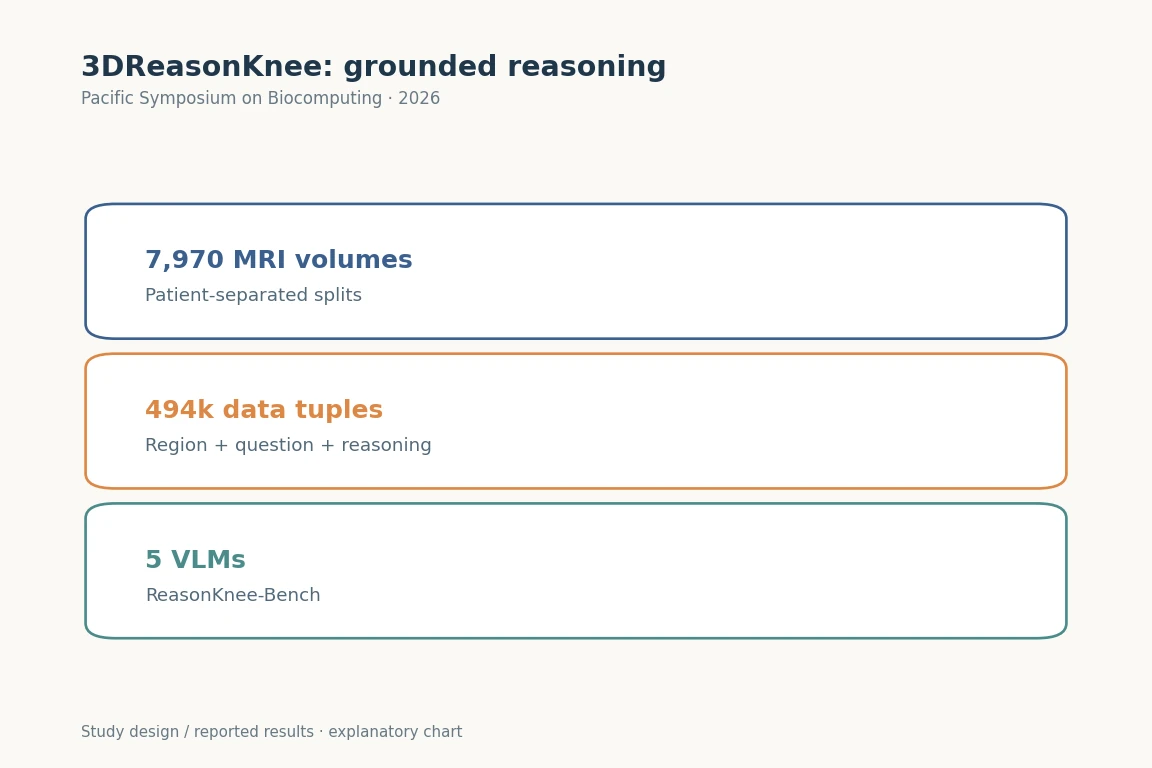
The 7,970 MRI volumes were split into 5,977 training, 797 validation and 1,196 test volumes without patient overlap.

Abstract · Original text

Sraavya Sambara, Sung Eun Kim, Xiaoman Zhang, Luyang Luo, Shreya Johri, Mohammed Baharoon, Du Hyun Ro, Pranav Rajpurkar. 3DReasonKnee: Advancing Grounded Reasoning in Medical Vision Language Models. Pacific Symposium on Biocomputing. Pacific Symposium on Biocomputing. 2026;31:99-113. doi:10.1142/9789819824755_0008.

Excerpt from the original abstract

Current Vision-Language Models (VLMs) struggle to ground anatomical regions in 3D medical images and reason about them in a step-by-step manner-a key requirement of realworld…

Keywords

  • Imaging, Three-Dimensional
  • Magnetic Resonance Imaging
  • Computational Biology
  • Knee
  • Artificial Intelligence
  • AI
  • MRI
  • vision-language models
2026Explanatory illustration
AlignmentCPAKOsteoarthritis

Does Joint-line Obliquity Explain OA Onset Better Than CPAK Type?

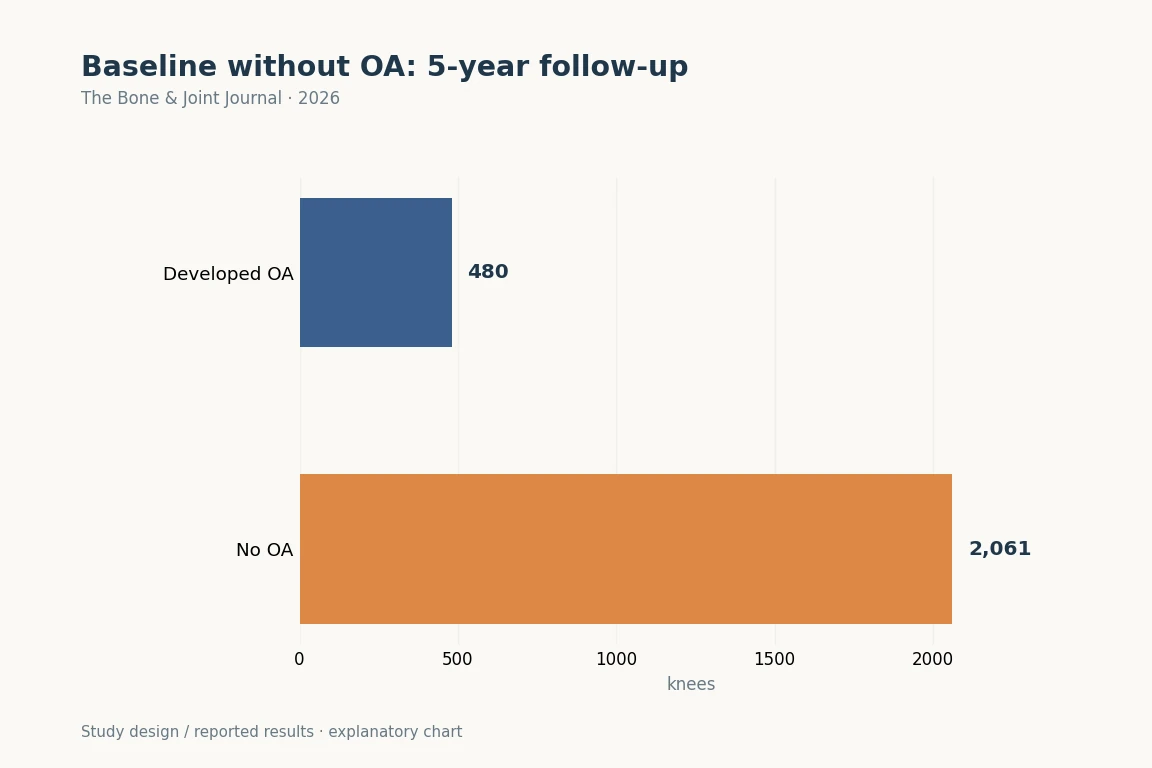
Over 5 years, 480 knees (18.9%) developed KL ≥2. CPAK type itself was not significantly associated with onset.

Abstract · Original text

Ji-Sahn Kim, Samuel J MacDessi, Do Weon Lee, Du Hyun Ro. Coronal alignment parameters of the knee predict osteoarthritis development : a Coronal Plane Alignment of the Knee classification-based analysis using the Multicenter Osteoarthritis Study data. The bone & joint journal. 2026;108-B(7):889-897. doi:10.1302/0301-620X.108B7.BJJ-2025-0687.R2.

AIMS

Mechanical varus or valgus alignment measures have been demonstrated to be closely related to knee osteoarthritis (KOA) development, but few attempts have been made to correlate the Coronal Plane Alignment of the Knee (CPAK) classification and disease development. This study hypothesized that certain CPAK types or deviations in CPAK parameters might enhance the risk of KOA development.

METHODS

KOA was defined as a Kellgren-Lawrence grade of 2 or higher. Data from 2,541 knees without KOA at baseline from the Multicenter Osteoarthritis Study (MOST) over five years of follow-up were examined. Differences in baseline CPAK types and parameters were analyzed between knees that developed KOA and those that did not. The association of CPAK type, arithmetic hip-knee-ankle angle (aHKA), and joint line obliquity (JLO) with the risk of disease development and joint line convergence angle (JLCA) changes were assessed.

RESULTS

Knees that developed KOA (480 knees; 18.9%) had significantly lower JLO (p = 0.022) and aHKA (p = 0.008) values than those that did not (2,061 knees; 81.1%). JLO was significantly associated with KOA development (odds ratio 1.048 (95% CI 1.001 to 1.098)). For knees with JLO values under the cut-off value of 171.6°, the risk of KOA development was 1.36 times higher than for those with values over the cut-off value (95% CI 1.053 to 1.770). aHKA showed a significant negative correlation with JLCA change (regression coefficient -0.139 (95% CI -0.241 to -0.036); p = 0.008). However, CPAK type itself showed no significant correlation with KOA development.

CONCLUSION

CPAK parameters, rather than types, were significantly associated with KOA development. Importantly, significant obliquity to the constitutional joint line might be as impactful as lower limb alignment. By potentially adjusting cut-off values, CPAK classification might be applied for predicting KOA development and investigating alignment-related aspects of KOA pathophysiology.

Keywords

  • Osteoarthritis, Knee
  • Knee Joint
  • Bone Malalignment
  • Alignment
  • CPAK
  • Osteoarthritis
  • MOST
2026Explanatory illustration
AIKOAKL

Can OA grades be classified consistently on knee X-rays from other hospitals?

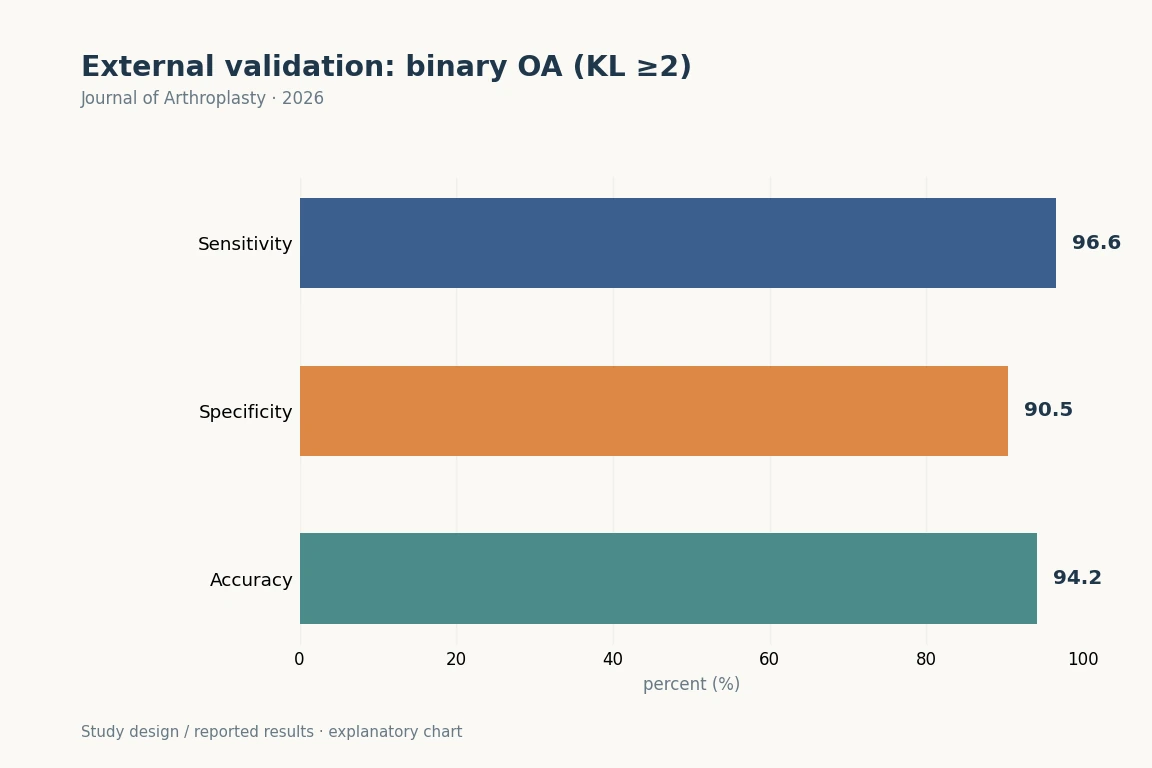
Binary OA detection (KL ≥2) had AUC 0.94 (95% CI 0.92–0.96), sensitivity 96.6%, specificity 90.5% and accuracy 94.2%.

Abstract · Original text

Byung Sun Choi, Seong Hwan Hong, Hae Jung Lee, Seong Hwan Kim. Performance of an Artificial Intelligence-Based Software for Automated Kellgren-Lawrence Grading of Knee Osteoarthritis: A Multicenter Cohort Study. Journal of Arthroplasty. 2026. doi:10.1016/j.arth.2026.01.078.

Excerpt from the original abstract

The Kellgren-Lawrence (KL) grading system is the standard for assessing knee osteoarthritis (OA) severity. However, it is limited by major observer variability.…

Keywords

  • Knee osteoarthritis
  • Kellgren-Lawrence
  • Artificial intelligence
  • Software
  • Diagnosis
  • AI
  • KOA
  • KL
2026Research Diagram
AIhallux valgusexternal validation

Can ViTPose Automatically Measure HVA and IMA on Preoperative and Postoperative Radiographs, Including Images with Metal Implants?

Internal MAEs were 1.09° for HVA and 0.76° for IMA; external MAEs were 1.33° and 0.81°, respectively.

Abstract · Original text

Sang Gyo Seo, Donghyuk Kwak, Sehun Kim, Min Gyu Kyung, Dong Yeon Lee, Du Hyun Ro, Jahyung Kim. Externally Validated Automated Measurement of Hallux Valgus on Pre- and Postoperative Weight-Bearing Radiographs Using a Transformer-Based Model. Clinics in Orthopedic Surgery. 2026. doi:10.4055/cios26232.

Background

Accurate measurement of the hallux valgus angle (HVA) and intermetatarsal angle (IMA) is essential for surgical planning and postoperative assessment in hallux valgus. However, manual measurement is time-consuming and subject to interobserver variability. Existing deep learning models are limited by reliance on preoperative radiographs and lack of external validation. Therefore, this study aimed to develop and externally validate a fully automated artificial intelligence (AI)–based system for HVA and IMA measurement on weight-bearing radiographs and to preliminarily evaluate its feasibility in postoperative radiographs containing metallic implants.

Methods

A transformer-based pose estimation architecture (ViTPose) was developed for automated HVA and IMA measurement on weight-bearing anteroposterior foot radiographs. The model was developed using 2,985 radiographs, including 217 postoperative radiographs with metallic implants or hardware-related image artifacts. The dataset was divided into training, validation, and internal test sets of 2,375, 297, and 313 radiographs, respectively. Performance was evaluated using internal and external validation cohorts. Accuracy was assessed using mean absolute error (MAE), intraclass correlation coefficient type 2 (ICC2), and Bland- Altman analysis. Subgroup analyses were performed by deformity severity and postoperative status.

Results

In the internal test cohort, MAEs were 1.09° for HVA and 0.76° for IMA, with excellent agreement with expert measurements (ICC2 = 0.99 and 0.95). External validation on 300 independent radiographs from 2 institutions demonstrated comparable performance against a consensus-reviewed reference standard, with MAEs of 1.33° for HVA and 0.81° for IMA. In the postoperative subgroup of the internal test set (n = 19), the model showed MAEs of 1.09° for HVA and 0.54° for IMA, with ICC2 values of 0.98 and 0.95, respectively. Severity classification agreement between predicted and reference measurements was 89.5% for HVA and 78.6% for IMA. Automated measurement required 0.49 seconds per image, approximately 30-fold faster than manual measurement.

Conclusions

This externally validated transformer-based system provided accurate, fully automated measurement of HVA and IMA on weight-bearing radiographs and showed preliminary feasibility in a limited postoperative subgroup. The proposed approach may serve as a practical AI-based measurement-support tool for preoperative assessment. Broader postoperative application requires further validation in larger cohorts encompassing diverse hallux valgus procedures and fixation constructs.

Keywords

  • Hallux valgus
  • Artificial intelligence
  • Deep learning
  • AI
  • hallux valgus
  • external validation
  • surgical planning

Copyright © 2026 by The Korean Orthopaedic Association

2026Research Diagram
alignmentCPAKFKP

Alignment progression in osteoarthritis: longitudinal comparison of ipsilateral and contralateral parameters

Bilateral classification agreement was 41.6% for FKP and 53.5% for CPAK at baseline, and 35.5% and 55.4%, respectively, at follow-up.

Abstract · Original text

Kee Soo Kang, Byung Sun Choi, Hyuk-Soo Han, Chong Bum Chang, Kwangho Chung, Du Hyun Ro. Contralateral Knee Alignment Parameters Have Limited Influence on Coronal Alignment Progression Compared With Ipsilateral Parameters in Patients With Knee Osteoarthritis. Cartilage. 2026:19476035261450111. doi:10.1177/19476035261450111.

ObjectiveTo compare alignment parameters in bilateral lower extremities and evaluate the effect of contralateral limb on hip-knee-ankle angle (HKAA) longitudinally.MethodsNative bilateral lower extremities of 3,045 Korean patients with long-leg radiographs were followed for progression of knee osteoarthritis. Concordance rates of Functional Knee Phenotypes (FKPs) and Coronal Plane Alignment of the Knee (CPAK), the proportion of patients with identical bilateral subtypes, were assessed. Varus, neutral, and valgus alignments were defined as baseline HKAA ≤177°, 177°< HKAA <183°, and HKAA ≥183°, respectively. Multivariable linear regressions for follow-up HKAA were conducted.ResultsConcordance rates for FKPs and CPAK were 41.6% (95% confidence interval: 39.9-43.4%) and 53.5% (51.7-55.2%), respectively, at baseline and 35.5% (33.8-37.2%) and 55.4% (53.7-57.2%) at a mean 4.0-year follow-up. Contralateral parameters, Kellgren-Lawrence grade (P = 0.005) in bilateral varus group, medial proximal tibial angle (MPTA) (P = 0.046) in ipsilateral varus-contralateral neutral group, MPTA, and mechanical lateral distal femoral angle in bilateral neutral (P < 0.001; P = 0.012, respectively) and valgus (P = 0.003; P = 0.004) groups, were associated with follow-up HKAA. However, their standardized β values were smaller than ipsilateral values.ConclusionConcordance rates of FKPs and CPAK between bilateral limbs were 41.6% and 53.5% at baseline, respectively. Contralateral parameters have limited influence on coronal alignment progression compared with ipsilateral parameters.

Keywords

  • Functional Knee Phenotypes
  • contralateral
  • coronal alignment
  • hip-knee-ankle angle
  • knee osteoarthritis
  • alignment
  • CPAK
  • FKP

© The Author(s) 2026

2026Research Diagram
TKAroboticsrestricted kinematic alignment

How Are Alignment Changes and Intraoperative Medial and Lateral Gaps Related to 1–2-year Patient-reported Outcomes in Robotic rKA TKA?

Smaller changes in HKA and LDFA were associated with higher 2-year Knee Society Knee Scores (P = 0.001 and 0.013).

Abstract · Original text

Do Weon Lee, Du Hyun Ro, Hyuk-Soo Han. Limited Femoral Joint-Line Alteration and Preserved Extension Lateral Laxity Enhanced Early Outcomes in Restricted Kinematic Alignment Total Knee Arthroplasty. The Journal of arthroplasty. 2026:S0883-5403(26)00519-X. doi:10.1016/j.arth.2026.05.029.

BACKGROUND

Restricted kinematic alignment (rKA) total knee arthroplasty (TKA) seeks to restore native alignment while limiting excessive correction. The influence of alignment change magnitude and intraoperative gap characteristics on early patient-reported outcome measures (PROMs) after robotic rKA TKA remains unclear.

METHODS

This retrospective cohort study included 69 robotic-arm-assisted cruciate-retaining TKAs performed using an rKA protocol. Intraoperative medial and lateral extension and flexion gaps-extension medial gap, extension lateral gap, flexion medial gap (FMG), and flexion lateral gap-were recorded automatically. Preoperative and postoperative hip-knee-ankle (HKA) angle, lateral distal femoral angle (LDFA), and medial proximal tibial angle were measured using a validated deep learning model. Multivariable analyses of covariance evaluated associations between demographics, baseline alignment, alignment changes, gap characteristics, and PROMs at one and two years.

RESULTS

All PROMs improved postoperatively. Smaller changes in HKA and LDFA were independently associated with higher two-year Knee Society Knee Scores (P = 0.001 and P = 0.013). Greater ELG was associated with a higher two-year Forgotten Joint Score (P = 0.001), whereas greater FMG was associated with lower two-year Western Ontario and McMaster Universities Osteoarthritis Index pain and stiffness scores (P = 0.011 and P = 0.002). Receiver operating characteristic analyses identified changes in LDFA less than 2.3° (area under the curve [AUC] 0.622) and changes in HKA less than 8.4° (AUC 0.541) as thresholds associated with higher Knee Society Knee Score. An ELG ≥ 3.0 mm predicted higher Forgotten Joint Score (AUC 0.658), and FMG ≥ 1.5 mm predicted lower Western Ontario and McMaster Universities Osteoarthritis Index stiffness (AUC 0.716). No revisions occurred.

CONCLUSIONS

In robotic cruciate-retaining rKA TKA, minimizing femoral joint-line alteration and preserving controlled lateral extension laxity, along with mild medial flexion laxity, were associated with modestly improved early outcomes. These findings are exploratory and require validation in larger cohorts with longer follow-up.

Keywords

  • intraoperative gap balance
  • joint line preservation
  • restricted kinematic alignment
  • robotic-assisted surgery
  • total knee arthroplasty
  • TKA
  • robotics
  • joint line
2026Research Diagram
TKAroboticsfunctional alignment

Does Better Balance in Robotic Surgery Translate into Patient-reported Benefits?

Varus–valgus range of motion decreased after surgery in all 3 groups. Postoperative range was greatest in the manual MA group, at 3.7° ± 1.4° (P = 0.048).

Abstract · Original text

Do Weon Lee, Joon Young Lee, Hyuk-Soo Han, Du Hyun Ro. Robotic Arm-Assisted Total Knee Arthroplasty Achieves More Symmetrical Mediolateral Balance without Significant Clinical Differences in the Short Term. The journal of knee surgery. 2026. doi:10.1055/a-2851-0619.

Excerpt from the original abstract

With the advent of robotic arm-assisted total knee arthroplasty (TKA), a different approach known as the functional alignment (FA) has been newly suggested. Studies have…

Keywords

  • Robotic-assisted total knee arthroplasty
  • Mediolateral balance
  • Short-term outcomes
  • TKA
  • robotics
  • functional alignment
  • mechanical alignment
  • gait
2026Research Diagram
shared decision makingTKAstudy protocol

How Will a Shared Decision-making Model Adapted to Korean Culture Be Evaluated?

The publication is a clinical-trial protocol, with no intervention-effect estimates. It defines the five SDM steps and the primary outcome measure, SDM-Q-9.

Abstract · Original text

Byung Sun Choi, Sujin Seo, Moon Jong Chang, Joong Il Kim, Seong Hwan Kim, Do Weon Lee, Du Hyun Ro, Hyoseon Choi, Hyuk-Soo Han. Study Protocol of a Korean Patient-Centered Shared Decision-Making Model for Management of Severe Knee Osteoarthritis: A Multicenter Pragmatic Clinical Trial (K-SDM-KOA). Journal of Korean medical science. 2026;41(4):e40. doi:10.3346/jkms.2026.41.e40.

Severe knee osteoarthritis (KOA) involves complex, preference-sensitive treatment decisions, ranging from non-operative to surgical options. However, despite the preference-sensitive nature of KOA, existing shared decision-making (SDM) processes often lack clarity in effectively incorporating patients' values and preferences into treatment decisions. Moreover, most SDM models have been developed in western contexts, which may limit their applicability in other cultural settings. To address these limitations, a Korean Shared Decision-Making Model for KOA (K-SDM-KOA) has been developed using a culturally adapted, five-step framework that integrates a web-based decision-support platform and age-friendly educational media. The K-SDM-KOA model is designed to support preference-sensitive decision-making through a pragmatic, multicenter cohort framework involving 1,300 patients with Kellgren-Lawrence grade 3-4 across five hospitals. Within this framework, patients receive either standard care or the K-SDM-KOA intervention, which combines pre-consultation preparation (step 1-3) with in-clinic deliberation and decision-making (step 4-5). The primary outcome is patient-perceived SDM measured using the Korean-validated 9-item Shared Decision Making Questionnaire, reported on a 0-100 scale, with higher scores indicating greater SDM. Secondary outcomes include patients' preferred role in decision-making, decisional conflict, decision regret, and knowledge gain related to KOA. Additionally, a nested cohort of 50 patients undergoing contralateral total knee arthroplasty will provide paired analyses of early pain and function (visual analogue scale, Western Ontario and McMaster Universities Osteoarthritis Index, Knee Society Score) at baseline, 3 months, and 12 months. Analyses will follow an intention-to-treat principle and employ linear mixed-effect models and appropriate statistical tests to assess between group differences. This article presents a culturally tailored, technology-supported SDM model designed to enhance decision quality and early patient-reported outcomes in severe KOA. Findings may provide a foundation for future empirical studies and support the broader adoption of structured SDM in Korea's healthcare system.

Keywords

  • Knee Osteoarthritis
  • Patient-Centered Care
  • Pragmatic Trial
  • Shared Decision Making
  • Study Protocol
  • Osteoarthritis, Knee
  • Decision Making, Shared
  • Republic of Korea

© 2026 The Korean Academy of Medical Sciences.

2026Research Diagram
TKAPROMlong-term outcomes

How Do Disease-specific and General-health PROMs Change over 15 Years after TKA?

All PROMs improved within 6 months; disease-specific outcomes were generally stable through 5 years.

Abstract · Original text

Byung Sun Choi, Du Hyun Ro, Hyuk-Soo Han. Long-Term Trajectories of Patient-Reported Outcomes Following Total Knee Arthroplasty: A Longitudinal Study of 1,264 Patients. The Journal of bone and joint surgery. American volume. 2026;108(5):355-362. doi:10.2106/JBJS.25.00770.

BACKGROUND

Although total knee arthroplasty (TKA) is known to improve patient-reported outcome measure (PROM) scores in the short term to midterm, the long-term trajectories of both disease-specific and generic PROM scores remain unclear.

METHODS

We retrospectively analyzed the prospectively collected registry data of 1,264 patients (mean age, 68.5 years; 93.7% female) who underwent primary TKA for osteoarthritis between 2005 and 2013 and completed PROM assessments at baseline and 10 years postoperatively. Disease-specific PROMs were assessed using the Knee Society Knee Score (KSKS), Knee Society Function Score (KSFS), and the Western Ontario and McMaster Universities Osteoarthritis Index (WOMAC). Generic PROMs were assessed using the Short Form-36 Health Survey (SF-36). Assessments were performed preoperatively and at 6 months and 1, 2, 5, 10, and 15 years postoperatively. Generalized linear models and linear mixed-effects models were used to evaluate temporal changes and subgroup differences by age and sex.

RESULTS

All PROM scores improved significantly within 6 months after TKA. Thereafter, disease-specific PROMs showed modest changes up to 1 year, with relative stability until 5 years, whereas generic PROMs demonstrated heterogeneous patterns across different domains. Between 5 and 10 years postoperatively, WOMAC pain and stiffness scores did not show significant changes, the KSKS decreased but not significantly so, and WOMAC physical function scores exhibited small but significant deterioration that was not clinically meaningful. SF-36 domains demonstrated varied trajectories: physical and mental component scores declined by more than the minimal clinically important difference after 5 years, whereas the social functioning score showed continuous improvement, although not all changes were significant. Octogenarians demonstrated lower physical functioning scores but higher social functioning scores in the long term compared with younger patients, and female patients demonstrated inferior functional and vitality scores compared with male patients.

CONCLUSIONS

Both disease-specific and generic PROM scores after TKA improved significantly and remained superior to baseline scores over a 15-year period, although physical function scores tended to decline in the long term. In this large, predominantly female Korean cohort, the distinct age- and sex-specific trajectories highlight the importance of implementing individualized, time-adapted long-term management strategies to optimize patient outcomes.

LEVEL OF EVIDENCE

Therapeutic Level III . See Instructions for Authors for a complete description of levels of evidence.

Keywords

  • Arthroplasty, Replacement, Knee
  • Patient Reported Outcome Measures
  • Osteoarthritis, Knee
  • Retrospective Studies
  • Longitudinal Studies
  • Treatment Outcome
  • Aged, 80 and over
  • Time Factors

Copyright © 2025 The Author(s). Published by The Journal of Bone and Joint Surgery, Incorporated.

2026Research Diagram
TKAperioperative safetydelirium

Are Preoperative Cognitive Function and Psychological Symptoms Associated with Delirium after TKA?

Postoperative delirium occurred in 24/574 patients (4.2%). At MMSE ≤25, sensitivity was 74.5%, specificity 78.3% and AUC 0.834.

Abstract · Original text

Joon Young Lee, Jee Eun Park, Sung Eun Kim, Byung Sun Choi, Myung Chul Lee, Chong Bum Chang, Hyuk-Soo Han, Hye Youn Park, Du Hyun Ro. Low Cognitive Function and Somatic Psychological Symptoms Are Correlated with Greater Risk of Delirium After Total Knee Arthroplasty: A Prospective Cohort Study. The Journal of bone and joint surgery. American volume. 2026;108(8):584-592. doi:10.2106/JBJS.25.00392.

Excerpt from the original abstract

Postoperative delirium (POD) is a clinically important complication in elderly patients undergoing total knee arthroplasty (TKA) that is associated with prolonged hospitalization, increased morbidity, and…

Keywords

  • Arthroplasty, Replacement, Knee
  • Delirium
  • Postoperative Complications
  • Cognitive Dysfunction
  • Prospective Studies
  • Risk Factors
  • Aged, 80 and over
  • TKA
2026Research Diagram
ACLmucoid degenerationinjection

What Effects Were Reported for Intraligamentous Steroid Injection in ACL Mucoid Degeneration Unresponsive to Conservative Treatment?

Pain improved in 78 of 82 knees (95.1%). Motion restriction resolved in 49 of the 50 knees that had restricted motion.

Abstract · Original text

Sang Yoon Kim, Byung Sun Choi, Du Hyun Ro, Hyuk-Soo Han. Efficacy of Intraligamentous Steroid Injection in Pain Reduction and Knee Motion Improvement in Patients with Mucoid Degeneration of the Anterior Cruciate Ligament. Clinics in orthopedic surgery. 2026;18(4):658-665. doi:10.4055/cios25280.

BACKGROUND

This study assessed the efficacy and safety of fluoroscopy-guided intraligamentous steroid injections in managing mucoid degeneration of the anterior cruciate ligament (MDACL) in patients resistant to oral medication and intra-articular steroid injections.

METHODS

A retrospective review of 294 knees diagnosed with MDACL via magnetic resonance imaging between October 2014 and June 2023 was conducted. After applying exclusion criteria and excluding patients who were asymptomatic or showed improvement with conservative treatment, 82 knees were included in the final analysis. Intraligamentous steroid injections were performed under C-arm fluoroscopy by a single orthopedic surgeon. Clinical data collected included the duration of the pain-free period, patient-reported outcome measures (PROMs; pain numeric rating scale, the International Knee Documentation Committee subjective score, Lysholm score, and Knee Injury and Osteoarthritis Outcome Score), range of motion, and other radiological measures. Symptom recurrence rates were determined using the Kaplan-Meier survival analysis.

RESULTS

The average age at the time of injection was 64.0 years (range, 39-83 years), and the mean follow-up period was 19.5 months (range, 12-90 months). Pain improvement was noted in 78 of 82 knees (95.1%), with an average effect duration of 7.8 months (standard deviation, 9.1). Improvement of limitation of knee motion was observed in 49 of 50 cases (98.0%). Kaplan-Meier analysis indicated symptom recurrence rates of 19.5% at 3 months, 39.0% at 6 months, and 48.8% at 1 year. All PROMs significantly improved after injection for 6 months (p < 0.01) and then slightly declined. No patients reported post-procedure instability.

CONCLUSIONS

Fluoroscopy-guided intraligamentous steroid injection demonstrated short-term efficacy in relieving pain and improving knee motion in MDACL patients resistant to conventional treatments, although further studies are warranted to confirm these findings.

Keywords

  • Anterior cruciate ligament
  • Fluoroscopy
  • Glucocorticoids
  • Knee joint
  • Mucoid degeneration
  • Anterior Cruciate Ligament
  • Steroids
  • Retrospective Studies

Copyright © 2026 by The Korean Orthopaedic Association

2025Explanatory illustration
AIJSWOA progression

Deep-learning oJSW measurement and quantitative joint-space narrowing assessment

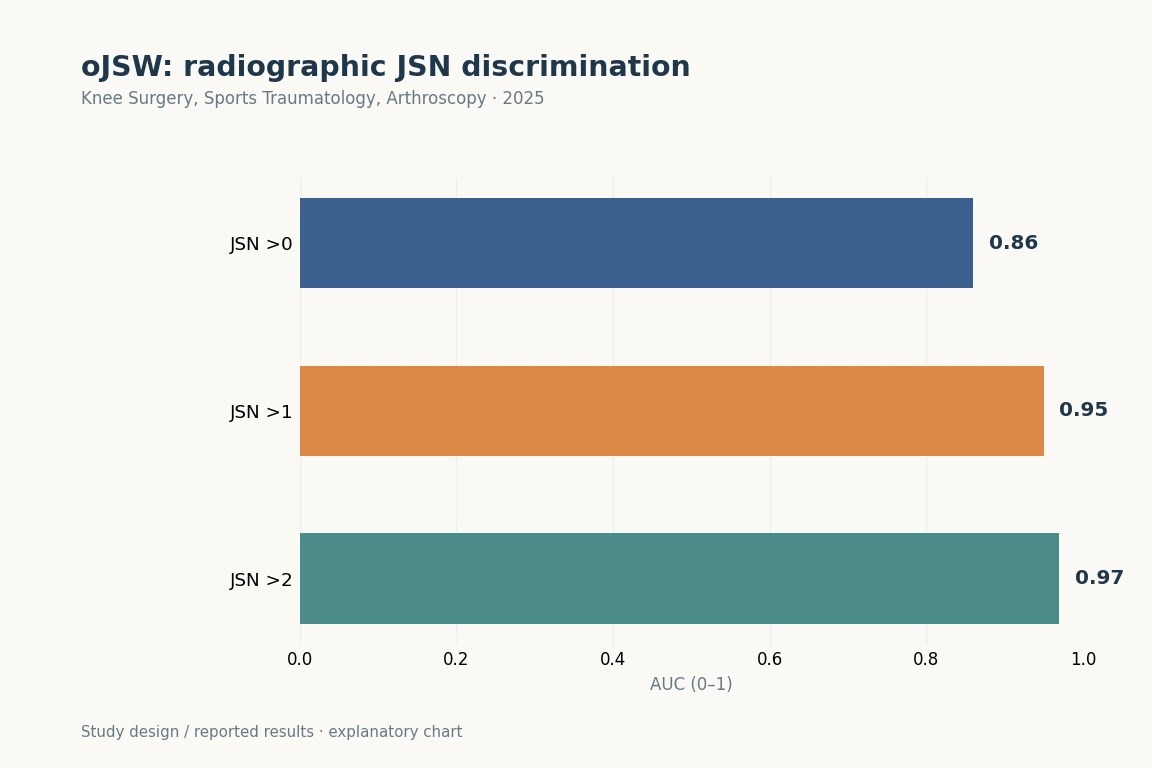
AUCs for discriminating JSN >0, >1 and >2 were 0.86, 0.95 and 0.97, respectively. The abstract summarises the absolute AUC advantage over fixed-location JSW as 0.04–0.08. These are cross-sectional discrimination results, not an individual’s probability of future osteoarthritis progression.

Abstract · Original text

Do Weon Lee, Dae Seok Song, Yong Seuk Lee, Ja-Young Choi, Du Hyun Ro. Deep learning-derived orthogonal minimum joint space width improves radiographic assessment of knee osteoarthritis severity and progression. Knee surgery, sports traumatology, arthroscopy : official journal of the ESSKA. 2025. doi:10.1002/ksa.70227.

PURPOSE

To evaluate the performance of a novel orthogonal minimum joint space width, defined as the narrowest distance measured orthogonally to the tibial joint line within a standardised medial axis, for detecting and monitoring knee osteoarthritis progression. This artificial intelligence-derived metric, obtained through deep learning, was compared with conventional fixed-location joint space width measures.

METHODS

A total of 15,313 knee radiographs from the Osteoarthritis Initiative (OAI), spanning baseline to 72-month follow-up, were analysed in this retrospective cohort study. Orthogonal minimum joint space width was automatically measured using a deep learning model. Discriminative ability for cross-sectional joint space narrowing severity was assessed using the area under the receiver operating characteristic curve. Longitudinal responsiveness was evaluated with the standardised response mean and relative standardised response mean, computed from pooled 12-month intervals and stratified by baseline narrowing grade. Variability was estimated through 1000 bootstrap resamples. Performance was compared with fixed-location measures at 22.5% and 25.0% from the medial edge of the tibial plateau.

RESULTS

Orthogonal minimum joint space width demonstrated strong discriminative performance, with area under the curve values of 0.86, 0.95 and 0.97 for joint space narrowing greater than grades 0, 1 and 2, respectively - exceeding the corresponding values for fixed-location measures by absolute margins of 0.04-0.08. Pooled relative standardised response mean analysis showed consistently higher responsiveness for orthogonal minimum joint space width, with median values of 0.97, 0.95 and 0.91 for baseline narrowing grades 0, 1 and 2, representing approximately 2%-4% greater responsiveness than fixed-location measures across all strata.

CONCLUSIONS

Orthogonal minimum joint space width, automatically quantified by deep learning, enhances both sensitivity and specificity for assessing knee osteoarthritis severity and progression. This metric may serve as a robust and reproducible structural imaging endpoint for clinical trials and longitudinal research.

LEVEL OF EVIDENCE

Level II.

Keywords

  • biomarkers
  • deep learning
  • joint space width
  • knee osteoarthritis
  • radiography
  • AI
  • JSW
  • OA progression
2025Explanatory illustration
ACLposterior tibial slopeAI measurement

Does Automatically Measured PTS Differ between East Asian Patients with ACL Tears and Controls?

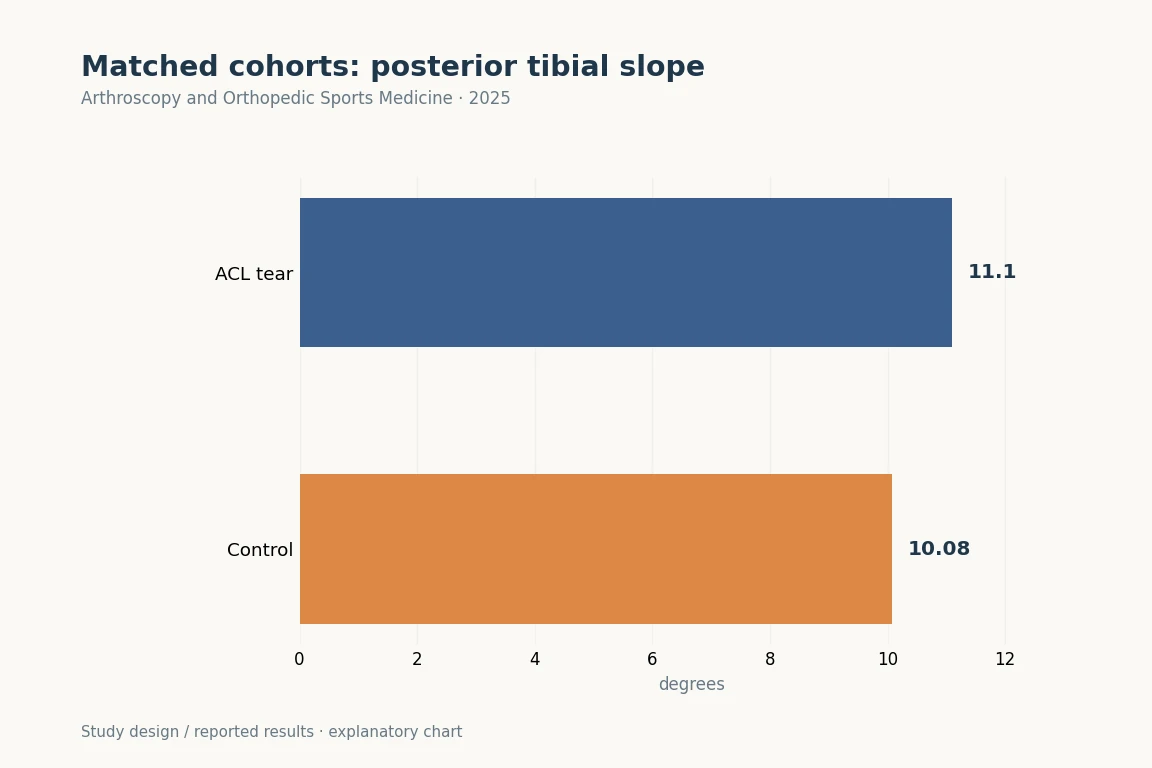
PTS was 11.10 ± 2.98° in the ACL-tear group and 10.08 ± 3.43° in controls, a difference of approximately 1° (P < 0.001).

Abstract · Original text

Donghyuk Kwak, Sung Eun Kim, Jaeseok Park, Hyuk-Soo Han, Byung Sun Choi, Du Hyun Ro. Posterior tibial slope as a risk factor for anterior cruciate ligament tears: a retrospective study using automated measurement. Arthroscopy and Orthopedic Sports Medicine. 2025. doi:10.14517/aosm25006.

Background

The association between anterior cruciate ligament (ACL) tears and posterior tibial slope (PTS) is well established; however, large-scale retrospective cohort studies in East Asian populations remain limited. Therefore, using a cohort from a tertiary hospital, this study aimed to investigate the difference in PTS between patients with ACL tears and matched controls.

Methods

Patients aged ≥ 18 years were included in both the ACL tear and control groups, excluding those with histories of lower limb surgery, tibial fractures, amputations, or posterior cruciate ligament injuries. Propensity score matching (1:1) was performed based on age, sex, and body mass index. Using a validated, landmark-based algorithm, PTS measurements were automatically obtained from lateral knee radiographs.

Results

After 1:1 propensity score matching, each group included 377 patients. The mean PTS was significantly higher in the ACL tear group (11.10° ± 2.98°) than in the control group (10.08° ± 3.43°) (P < 0.001). No significant differences were found in age (ACL tear, 35.96 ± 13.79 years; control, 35.40 ± 15.20 years, P = 0.60), body mass index (ACL tear, 25.28 ± 3.88; control, 24.96 ± 4.33, P = 0.29), or sex (ACL tear, 78.5% male; control: 78.8% male, P > 0.999). When a cutoff value of 9.42° was applied, the incidence of ACL tears was significantly higher in individuals with PTS ≥ 9.42° (55.3%) than in those with 9.42° (40.8%) (P < 0.001).

Conclusion

This study shows that a greater PTS is significantly associated with ACL tears in an East Asian cohort, as patients with ACL injuries had an average PTS roughly 1° higher than that of matched controls.

Keywords

  • Tibia
  • Anterior cruciate ligament injuries
  • Risk factors
  • ACL
  • posterior tibial slope
  • AI measurement
  • propensity matching

© 2025 Korean Arthroscopy Society and Korean Orthopedic Society for Sports Medicine.

2025Explanatory illustration
AIposterior tibial slopeACL

Can Landmark-based PTS Be Measured on Limited-field Lateral Radiographs or Images without a Calibration Scale?

ICCs against manual measurement were 0.91 for the short axis and 0.92 for the long axis. Automated repeat-measurement ICC was 1.00.

Abstract · Original text

ByeongYeong Ryu, Jun Woo Nam, Du Hyun Ro, R Kyle Martin, Eivind Inderhaug, Andreas Persson, Sanna Haland, Sung Eun Kim. Automated Posterior Tibial Slope Measurement Using Lateral Knee Radiographs: A Novel Landmark-Based Approach Using Deep Learning. Orthopaedic journal of sports medicine. 2025;13(4):23259671251331067. doi:10.1177/23259671251331067.

BACKGROUND

A single universally accepted protocol does not exist for measuring the posterior tibial slope (PTS), limiting the application of cutoff values for surgical decision-making and risk stratification.

PURPOSE/HYPOTHESIS

This purpose of this study was to validate an online computer vision model using anatomic landmarks for PTS measurement on uncalibrated lateral knee radiographs. It was hypothesized that this model would achieve similar accuracy to manual measurement.

STUDY DESIGN

Cohort study; Level of evidence, 2.

METHODS

A total of 10,007 lateral knee radiographs collected between January 2009 and December 2019 were utilized. The data set comprised 9277 (93%) training, 500 (5%) validation, and 230 (2%) test radiographs. After defining "A" as the distance from the tibial joint line to the proximal aspect of the tibial tuberosity, 2 landmark-based methods for determining the tibial shaft axis were developed based on lines connecting the tibia midpoints at distances: (1) 2A and 3A (short method) and (2) 2A and 4A (long method). The PTS was then calculated using each tibial shaft axis. Model performance was evaluated against orthopaedic specialists' measurements using inter- and intraobserver intraclass correlation coefficients (ICCs). Model performance on shortened images, subcategorized into normal, osteoarthritic, and implant-embedded knees, was also assessed, along with time efficiency comparisons.

RESULTS

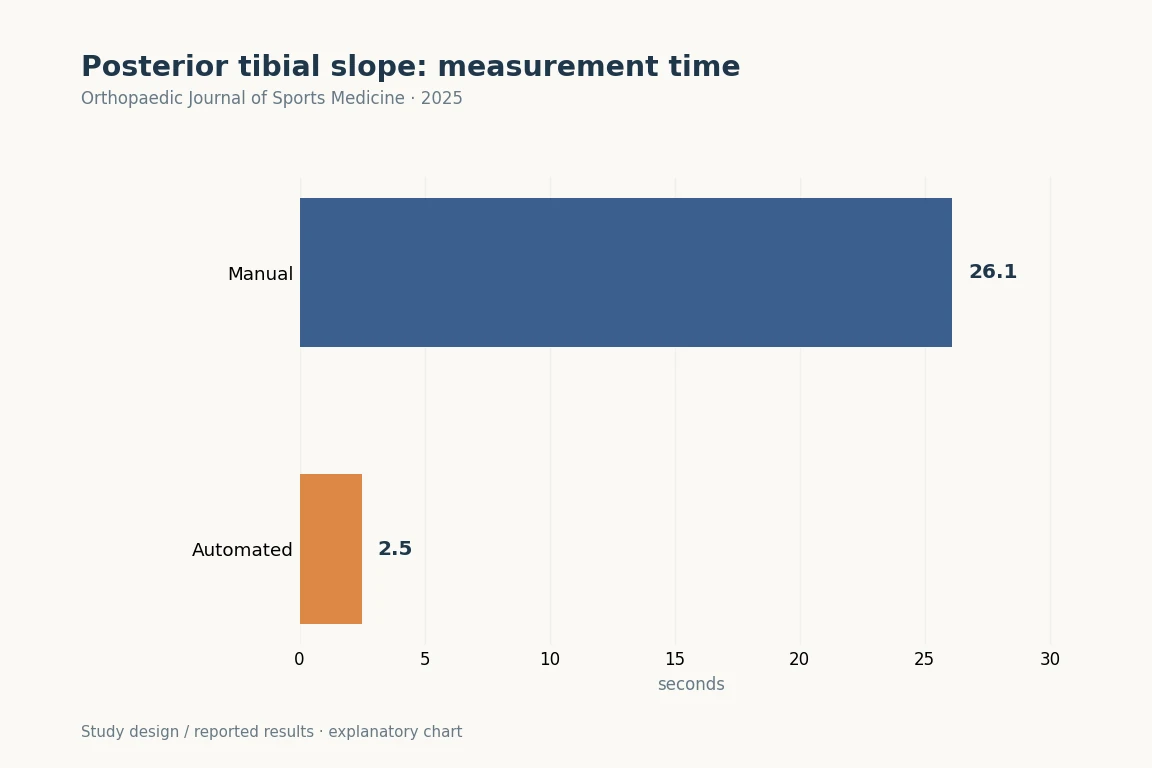
The overall interobservers ICCs were 0.91 for the short method and 0.92 for the long method against manual measurement. The ICCs for normal, osteoarthritic, and implant-embedded radiographs were 0.84, 0.90, and 0.97 for the short method and 0.88, 0.91, and 0.97 for the long method, respectively. The intraobserver ICC for the computer vision model was a perfect 1.00, while manual measurements showed ICCs of 0.89 for the short method and 0.95 for the long method. The mean model measurement time was 2.5 ± 0.7 seconds, compared with 26.1 ± 1.9 seconds for the manual measurement (P < .001).

CONCLUSION

A novel, time-efficient, deep learning model for measuring PTS demonstrated excellent accuracy and consistency across various lateral knee radiographs. If externally validated, this model may enable a pathway for direct clinical translation of research findings by providing a standardized measurement tool.

Keywords

  • automated measurement
  • computer vision model
  • deep learning
  • landmark-based
  • posterior tibial slope
  • AI
  • ACL
  • HTO

© 2025 The Author(s)

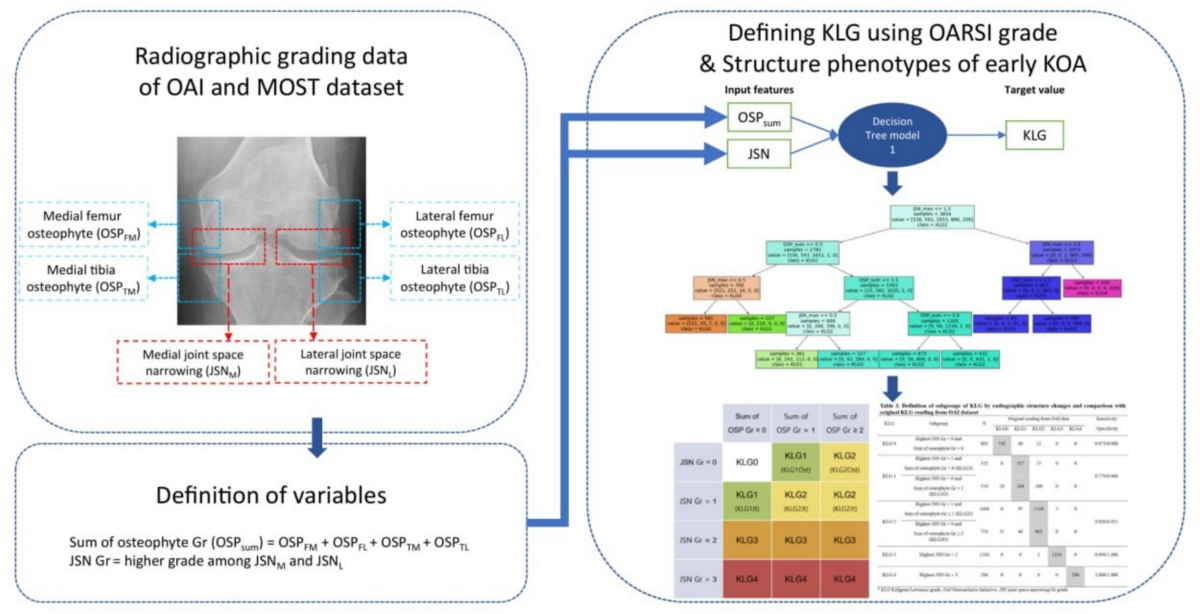
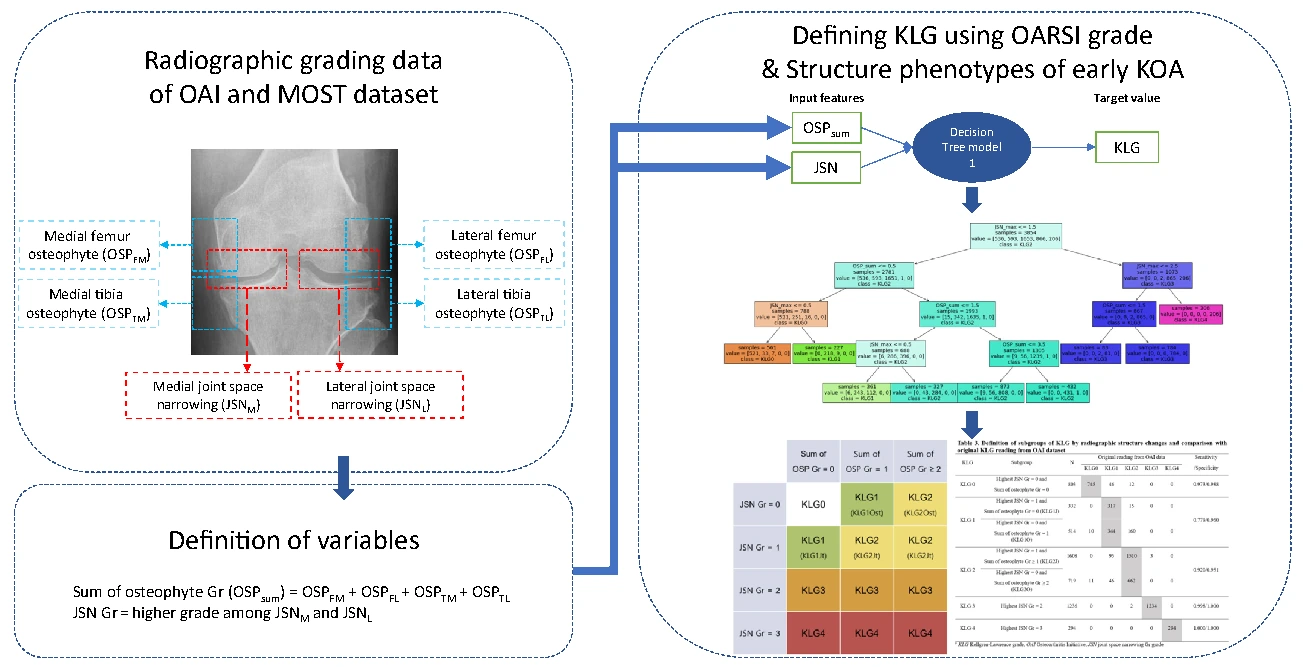
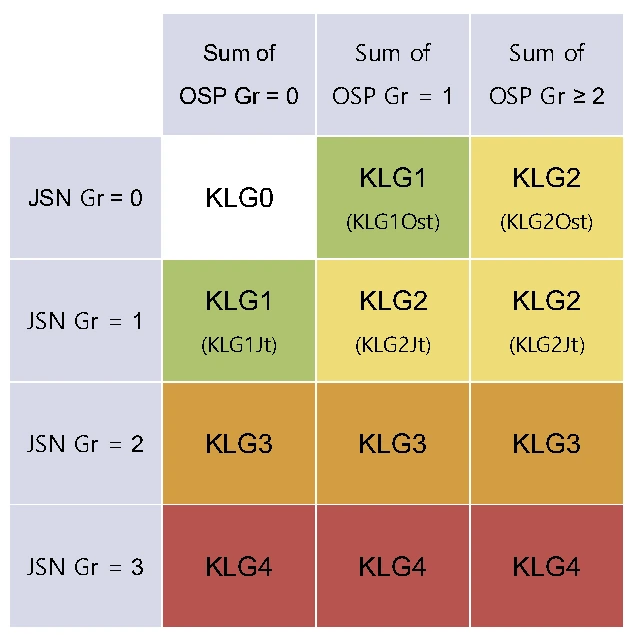
Original study workflow uses osteophytes and joint space narrowing on OAI and MOST radiographs to distinguish early OA structural phenotypes.
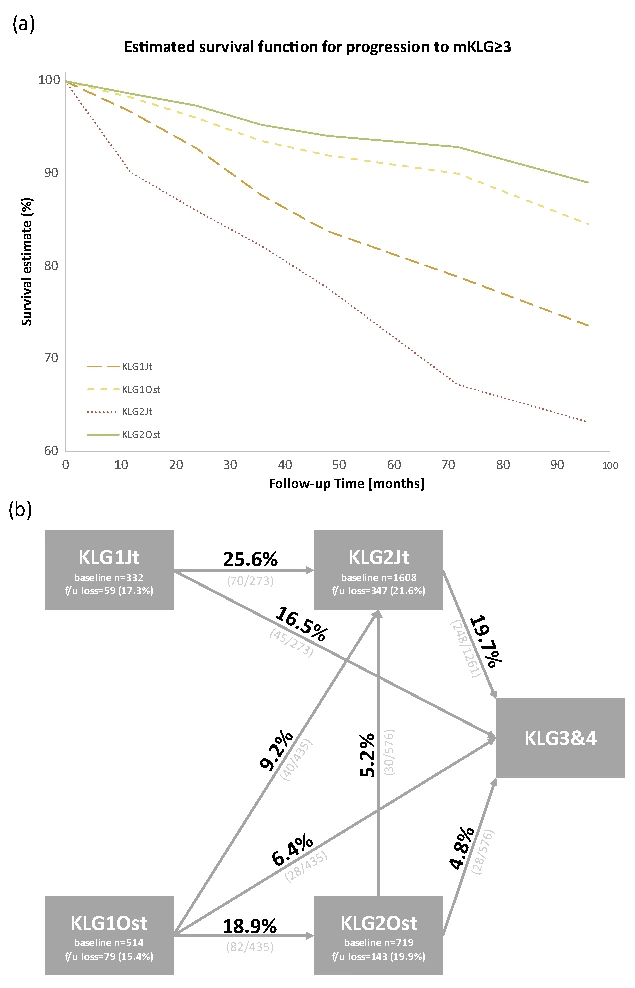
The original table subdivides KL grades by joint space narrowing and osteophytes. Structural phenotypes can differ within a grade.Survival curves and mean progression times to KL 3 or higher by structural phenotype. Current pain and radiographic progression should be interpreted separately.
2025Original figures and charts
OAradiographic phenotypeKellgren-Lawrence

Can Knees with the Same OA Grade Progress at Different Rates?

Within the same KL grade 1 or 2, pain and function did not differ between osteophyte-predominant and joint-space-narrowing-predominant groups.

Abstract · Original text

Sunho Ko, Yunhee Choi, Hyuk-Soo Han, Seong Hwan Kim, Du Hyun Ro. Association of radiographic structure deformity phenotypes of knee OA to clinical symptoms and risk for progression: Proposing a modification of Kellgren-Lawrence grade - Data from the Osteoarthritis Initiative and the MOST study. Osteoarthritis and cartilage open. 2025;7(1):100566. doi:10.1016/j.ocarto.2025.100566.

OBJECTIVE

This study aims to define Kellgren-Lawrence grade (KLG) using OARSI grade and stratify radiographic knee osteoarthritis (KOA) into distinct phenotypes based on radiographic structure changes and compare clinical symptoms and disease progression.

DESIGN

We used radiographic grading data provided by the OAI and MOST study. Decision tree was used to (1) Find OARSI grade criteria for each KLG and (2) Phenotype early osteoarthritic knees (=KLG1, 2) by the radiographic structure changes. Pain, function, and progression to KLG ≥3 were compared between phenotypes.

RESULTS

10,804 knees from 5802 patients were included. The mean follow-up duration was 55.6 ​± ​24.5 months. Criteria for KLG1 was: (1) Joint space narrowing (JSN) grade (more severe grade among medial and lateral compartments) ​= ​1 without osteophytes (i.e., KLG1Jt) (2) A single grade 1 osteophyte without JSN (i.e., KLG1Ost). Criteria for KLG2 was (1) JSN ​= ​1 with a sum of osteophyte grades ≥1 (i.e., KLG2Jt): (2) Sum of osteophyte grades ≥2 without JSN (i.e., KLG2Ost). In terms of pain and function, there was no difference between KLG1Ost and KLG1Jt or between KLG2Ost and KLG2Jt. For progression to KLG ≥3, the mean survival time of KLG1Ost was 1.87-fold (95 ​% CI: 1.31-2.67) longer than that of KLG1Jt, while KLG2Ost was 5.42-fold (95 ​% CI: 3.69-7.96) longer than KLG2Jt.

CONCLUSIONS

We proposed the criteria for each KLG using OARSI grade and phenotypes characterized by radiographic structure deformity in early KLG. Within the same KLG, the rate of disease progression was different depending on the structural deformity.

Keywords

  • Artificial intelligence
  • Kellgren-Lawrence
  • Knee osteoarthritis
  • Machine learning
  • OARSI
  • OA
  • radiographic phenotype
  • progression

© 2025 The Author(s)

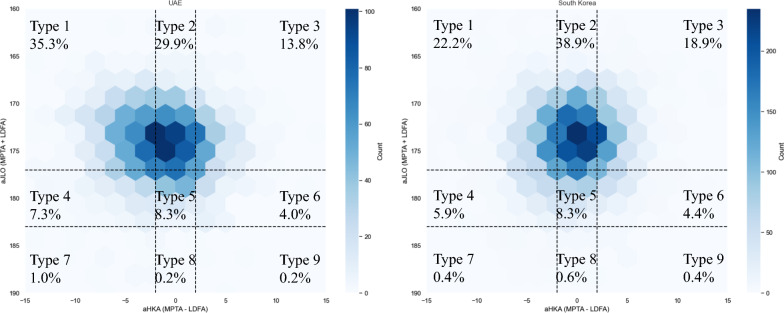
The AHKA and joint line slope of the JLO distribution in UAE and South Korea patients is shown above CPAK zone Figure 2.
2025Original figures and charts
CPAKalignmentpopulation differences

CPAK distributions in symptomatic Korean and UAE cohorts

The most common CPAK type among men was type I in the UAE (42.4%) and type II in Korea (30.6%). Type II was most common among women in both populations (UAE 30.6%, Korea 35.3%).

Abstract · Original text

Jisoon Park, Oussama Chaar, Jayakrishnan Narayanakurup, Alamedin Sobhe Abdelsamea Abdelhamead, Du Hyun Ro, Sung Eun Kim. Do knee alignment patterns differ between Middle Eastern and East Asian populations? A propensity-matched analysis using artificial intelligence. Knee surgery & related research. 2025;37(1):11. doi:10.1186/s43019-025-00261-w.

INTRODUCTION

Population-based differences in knee alignment patterns may impact osteoarthritis (OA) progression. This study compares lower extremity alignment in knee OA between Middle Eastern (UAE) and East Asian (South Korean) populations using artificial intelligence (AI)-assisted analysis.

METHODS

A retrospective review included patients with knee symptoms from South Korea (2009-2019) and the United Arab Emirates (UAE) (2015-2024). Exclusion criteria comprised prior knee surgeries, significant bony attrition, and low-quality radiographs. Propensity score matching controlled for age and sex differences between populations. Alignment parameters (hip-knee-ankle angle (HKA), medial proximal tibial angle (MPTA), lateral distal femoral angle (LDFA), and joint line convergence angle (JLCA)) and OA severity (Kellgren-Lawrence (KL) grade) were measured using artificial intelligence (AI) software, along with the analysis of coronal plane alignment of the knee (CPAK) classification. Subanalyses by sex and age group (under 40, 40-60, and over 60 years) were also conducted.

RESULTS

A total of 1098 UAE and 7138 South Korean patients (2196 and 14,276 knees, respectively) were evaluated in this study. Post-matching (1:2), body mass index was significantly higher in UAE patients (p < 0.001). CPAK type 1 was predominant in UAE male patients (42.4%), whereas type 2 was more common in South Korean male patients (30.6%). Female patients in both populations predominantly exhibited CPAK type 2 (UAE 30.6%; South Korea 35.3%). UAE patients showed a lower MPTA with increasing age, indicating a trend toward more varus alignment in older individuals.

CONCLUSIONS

A propensity score-matched analysis revealed significant alignment differences between Middle Eastern and East Asian populations, underscoring the importance of population-specific considerations in OA management.

Keywords

  • Knee alignment
  • Middle East
  • Osteoarthritis
  • Populations
  • Propensity score-matched
  • South Korea
  • CPAK
  • alignment

© The Author(s) 2025

2025Original figures and charts
AIposterior tibial slopeexternal validation

Can a PTS Model Developed in Korea Be Applied to Limited-field Radiographs of Norwegian Patients with ACL Injuries?

ICC was 0.73–0.80 between automated and manual measurements, 0.86 between manual raters, 0.92 within raters and 1.00 for repeated model measurements.

Abstract · Original text

Kyle R Martin, Sanna Haaland, Andreas Persson, Sung Eun Kim, ByeongYeong Ryu, Jun Woo Nam, Du Huy Ro, Eivind Inderhaug. External Validation of a Novel Landmark-Based Deep Learning Automated Tibial Slope Measurement Algorithm Applied on Short Radiographs Obtained in Patients With ACL Injuries. Orthopaedic journal of sports medicine. 2025;13(5):23259671251333607. doi:10.1177/23259671251333607.

BACKGROUND

Deep learning algorithms can aid medical decision-making by performing routine tasks without any human error. Reading of standardized radiographs lends itself well to a computerized approach. The posterior tibial slope is increasingly recognized as a factor in lower leg biomechanics. Slope readings should, therefore, be readily available when considering knee ligament or knee replacement surgery.

PURPOSE/HYPOTHESIS

The purpose was to externally validate a deep learning model developed for posterior tibial slope readings by applying an independent data set, not included in initial development, for testing the reliability of the model, compared with human performance testing. It was hypothesized that a computerized approach would yield a reliability similar to that of human analyses.

STUDY DESIGN

Descriptive laboratory study.

METHODS

A consecutive series of lateral knee radiographs obtained in patients undergoing anterior cruciate ligament surgery were eligible for inclusion. Two independent experienced clinicians individually assessed the tibial slope measurement to establish the interreader reliability. Furthermore, all images were processed by the newly developed model for the automated readings. Intrarater and interrater reliability were thereafter established between readers and between manual and automated readings, measured by intraclass correlation coefficients (ICCs). Time consumption between methods was noted. Extreme differences between the 2 methods were analyzed for potential errors.

RESULTS

A total of 289 radiographs were included in the study and therefore analyzed by both the manual and the automated method. A mean tibial slope of 9.7° (SD, 2.7°; range, 3.0°-19.1°) was found. The interrater and intrarater measurements between the independent measurers for the 2-circle method were 0.86 and 0.92. Furthermore, the intrarater agreement of the model was 1.00, while an ICC between 0.73 and 0.80 was found when comparing automated with manual measurement. The mean time consumption for manual readings was 52.5 seconds, while for automated readings it was 28.2 seconds.

CONCLUSION

In this external validation of a newly developed model for automated readings of tibial slope measures, a perfect intrarater reliability and a good interrater reliability were seen. Although the model needs further refinement in reporting the tibial slope as compared with a gold standard manual measurement, it clearly demonstrates the elimination of human variance with repeat readings and less time consumption than that with human effort.

Keywords

  • anterior cruciate ligament
  • artificial intelligence
  • automated reading
  • deep learning
  • posterior tibial slope
  • radiographs
  • AI
  • external validation

© The Author(s) 2025

2025Original figures and charts
TKArevisionPJI

What Are the Risk Factors for PJI Recurrence after Two-stage Reimplantation?

Infection recurred in 15/65 patients (23.1%). Median time to recurrence was 11 months (range 4–108 months).

Abstract · Original text

Do Weon Lee, Hyuk-Soo Han, Du Hyun Ro. Risk factors of recurrent periprosthetic joint infection of the knee after two-stage reimplantation. Knee surgery & related research. 2025;37(1):4. doi:10.1186/s43019-025-00258-5.

INTRODUCTION

Prosthetic joint infection (PJI) is one of the most common and detrimental complications of total knee replacement arthroplasty (TKA). Despite extensive efforts, including two-stage reimplantation, to eradicate PJI, it still recurs in a substantial number of patients. However, the risk factors of recurrence after two-stage reimplantation of the knee have not been established. In this study, it is hypothesized that there will be certain risk factors of recurrence after two-stage reimplantation for PJI of the knee.

MATERIALS AND METHODS

From March 2002 to December 2022, 65 knees that underwent two-stage reimplantation for PJIs in a single, tertiary hospital were retrospectively reviewed, and 44 patient-related, laboratory-related, and surgery-related factors, including body mass index, pathogen type, and the usage of transfusions, were selected as the potential risk factors for recurrence. Survival analysis using the Kaplan-Meier method and subsequent Cox proportional hazard regression were performed.

RESULTS

Out of the 65 knees that underwent two-stage reimplantation, infection recurred in 15 knees (23.1%) in a median 11 (range 4-108) months. The Cox proportional hazards regression showed that infection of revision TKA, mixed pathogen-type infection, and higher serum erythrocyte sedimentation rate (ESR, mm/h) level increases the risk of recurrence (p-values < 0.001, 0.04, and 0.009; hazard ratios 40.29, 1.53, and 1.03, respectively).

CONCLUSIONS

A significant portion of PJI of the knees recurred after two-stage reimplantation. Revision TKA at the time of initial PJI, mixed pathogen-type infection, and higher serum ESR level were three significant risk factors of PJI recurrence. Surgeons should be more cautious in suspecting PJI relapse for these specific occasions.

LEVEL OF EVIDENCE

III, retrospective cohort study.

Keywords

  • Prosthesis-related infection
  • Survival analysis
  • Total knee arthroplasty
  • TKA
  • revision
  • PJI

© The Author(s) 2025

2025Original figures and charts
PFJpatellofemoral paingait

How Are Muscle-activation Changes in PFPS Related to the Sagittal Knee Moment during Walking?

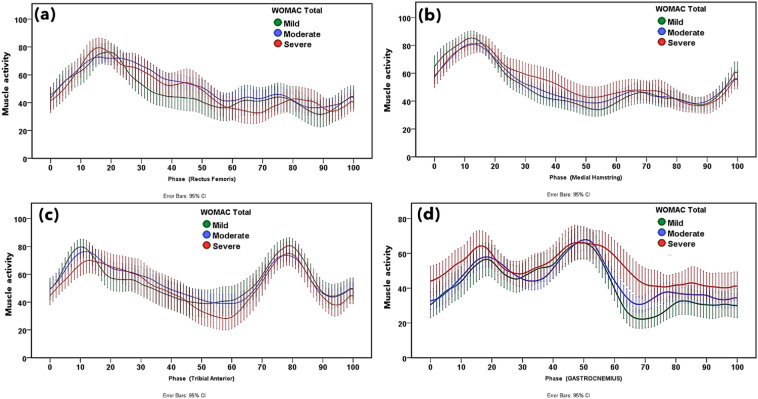
The PFPS group had lower knee-extension moment during weight acceptance, without a significant difference in flexion angle. ST activity was higher throughout gait.

Abstract · Original text

Byung Sun Choi, Soon Bin Kwon, Sehyeon Jeon, Myeongjun Kim, Yunseo Ku, Du Hyun Ro, Hyuk-Soo Han. Relationship between muscle activation and sagittal knee joint biomechanics in patients with patellofemoral pain syndrome: a cross-sectional study. Knee surgery & related research. 2025;37(1):7. doi:10.1186/s43019-025-00259-4.

BACKGROUND

Patellofemoral pain syndrome (PFPS) is one of the most common conditions affecting the knee joint, yet its pathomechanics remain unclear. The aim of this study was to investigate changes in muscle activation and gait patterns and to analyze the relationship between muscle activation and kinetic gait patterns in patients with PFPS.

METHODS

This study included 31 patients with PFPS and 28 healthy volunteers without any symptoms. The sagittal plane motion of the knee joint, representing primary movement of the knee joint, was evaluated to identify changes in gait patterns. Electromyography (EMG) was used to measure muscle activation of vastus medialis (VM), vastus lateralis (VL), semitendinosus (ST), and gastrocnemius (GCM) muscles during gait analysis. Biomechanical features were analyzed during the three phases of the gait cycle; weight acceptance (WA), single limb support (SLS), and swing limb advancement (SLA) (0 ~ 12%, 13 ~ 50%, and 51 ~ 100% of the gait cycle, respectively).

RESULTS

The average knee extension moment (KEM) during WA was lower in the patient group and no significant differences were observed in the knee flexion angle (KFA). With respect to muscle activation, the patient group showed significantly higher muscle activation of the ST muscle in all phases. As the absolute value of the moment increased, the activation of the VM, VL, and ST muscles increased more rapidly in the patient group, especially when KEM was under -1% body weight × height (Bw × Ht) or over 5% Bw × Ht.

CONCLUSIONS

Patients with PFPS exhibit elevated muscle activation, particularly in response to changes in the knee extension moment, which is likely a compensatory mechanism to manage knee joint loading during gait. These results highlight altered neuromuscular adaptations in PFPS, suggesting targeted therapies may help improve functional outcomes. Level of evidence III, cross-sectional study.

Keywords

  • Electromyography
  • Gait analysis
  • Patellofemoral pain syndrome
  • PFJ
  • patellofemoral pain
  • gait
  • EMG

© The Author(s) 2025

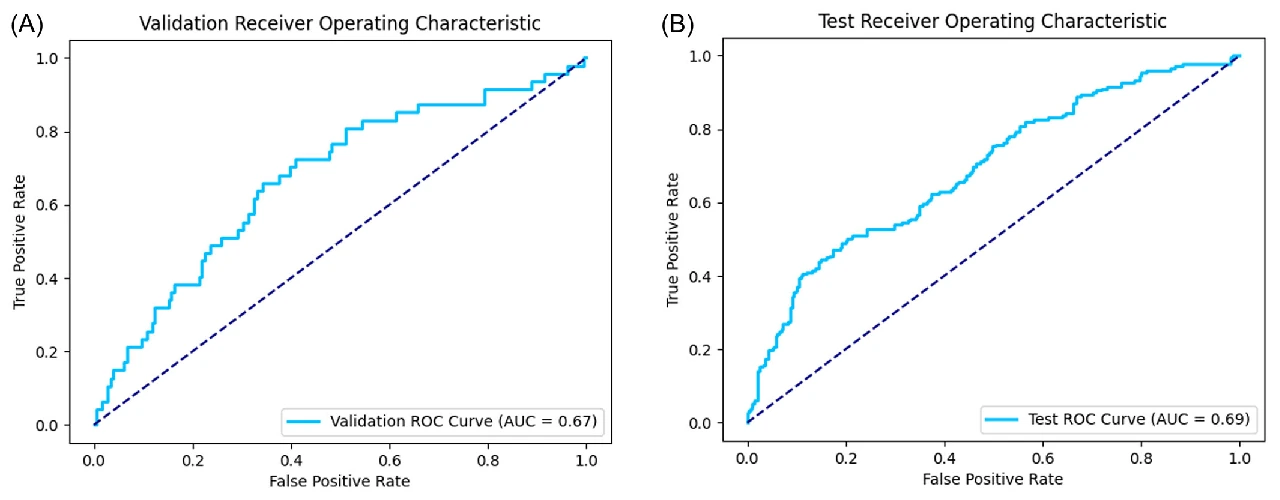
Confusion matrix and ROC curve in the independent MOST cohort. Radiographic progression was evaluated with AUC 0.76 and accuracy 0.68.
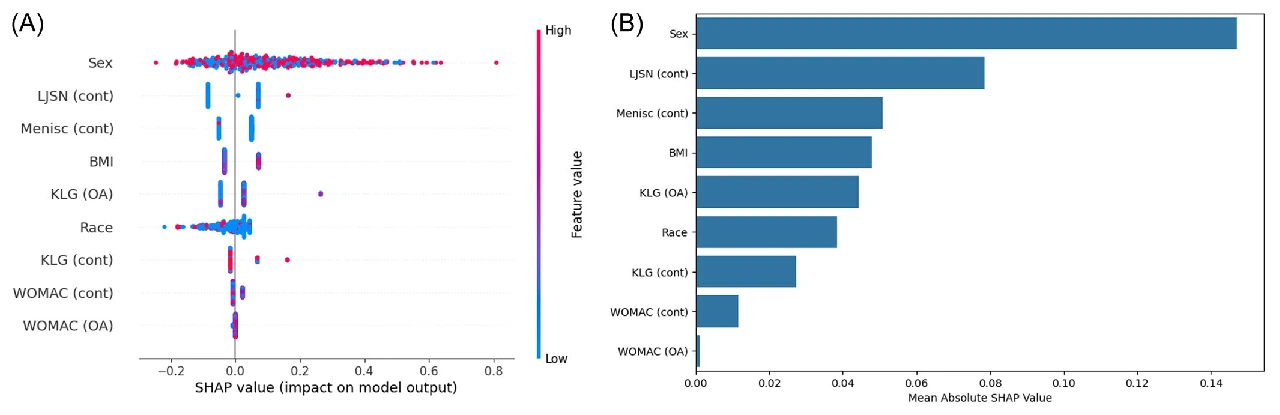
SHAP analysis of the six predictors shows contributions of baseline KL grade, contralateral OA, joint space narrowing, BMI and WOMAC.The paper shows example inputs and outputs from its web model. The prediction target was radiographic progression over 4–5 years.
2025Original figures and charts
OA progressionmachine learningexternal validation

Predicting radiographic knee osteoarthritis progression: external validation of a machine-learning model

External validation in MOST yielded an AUC of 0.76, accuracy of 0.68 and F1 of 0.56.

Abstract · Original text

Do Weon Lee, Hyuk-Soo Han, Du Hyun Ro, Yong Seuk Lee. Development of the machine learning model that is highly validated and easily applicable to predict radiographic knee osteoarthritis progression. Journal of orthopaedic research : official publication of the Orthopaedic Research Society. 2025;43(1):128-138. doi:10.1002/jor.25982.

Many models using the aid of artificial intelligence have been recently proposed to predict the progression of knee osteoarthritis. However, previous models have not been properly validated with an external data set or have reported poor predictive performances. Therefore, the purpose of this study was to design a machine learning model for knee osteoarthritis progression, focusing on high validation quality and clinical applicability. A retrospective analysis was conducted on prospectively collected data, using the Osteoarthritis Initiative data set (5966 knees) for model development and the Multicenter Osteoarthritis Study data set (3392 knees) for validation. The analysis aimed to predict Kellgren-Lawrence grade (KLG) progression over 4-5 years in knees with initial KLG of 0, 1, or 2. Possible predictors included demographics, comorbidities, history of meniscectomy, gait speed, Western Ontario and McMaster Universities Osteoarthritis Index (WOMAC) scores, and radiological findings. The Random Forest algorithm was employed for the predictive model development. Baseline KLG, contralateral knee osteoarthritis, lateral joint space narrowing (JSN) grade, BMI, medial JSN grade, and total WOMAC score were six features selected for the model in descending order of importance. Odds ratios of baseline KLG, contralateral knee osteoarthritis, and lateral JSN grade were 1.76, 2.59, and 4.74, respectively (all p < 0.001). The area-under-the-curve of the ROC curve in the validation set was 0.76 with an accuracy of 0.68 and an F1-score of 0.56. The progression of knee osteoarthritis in 4 ~ 5 years could be well-predicted using easily available variables. This simple and validated model may aid surgeons in knee osteoarthritis patient management.

Keywords

  • knee
  • machine learning
  • osteoarthritis
  • prediction
  • validation
  • Osteoarthritis, Knee
  • Machine Learning
  • Disease Progression
2025Explanatory illustration
AIhip fractureexternal validation

Deep learning for hip fracture classification: external validation and reader-assistance evaluation

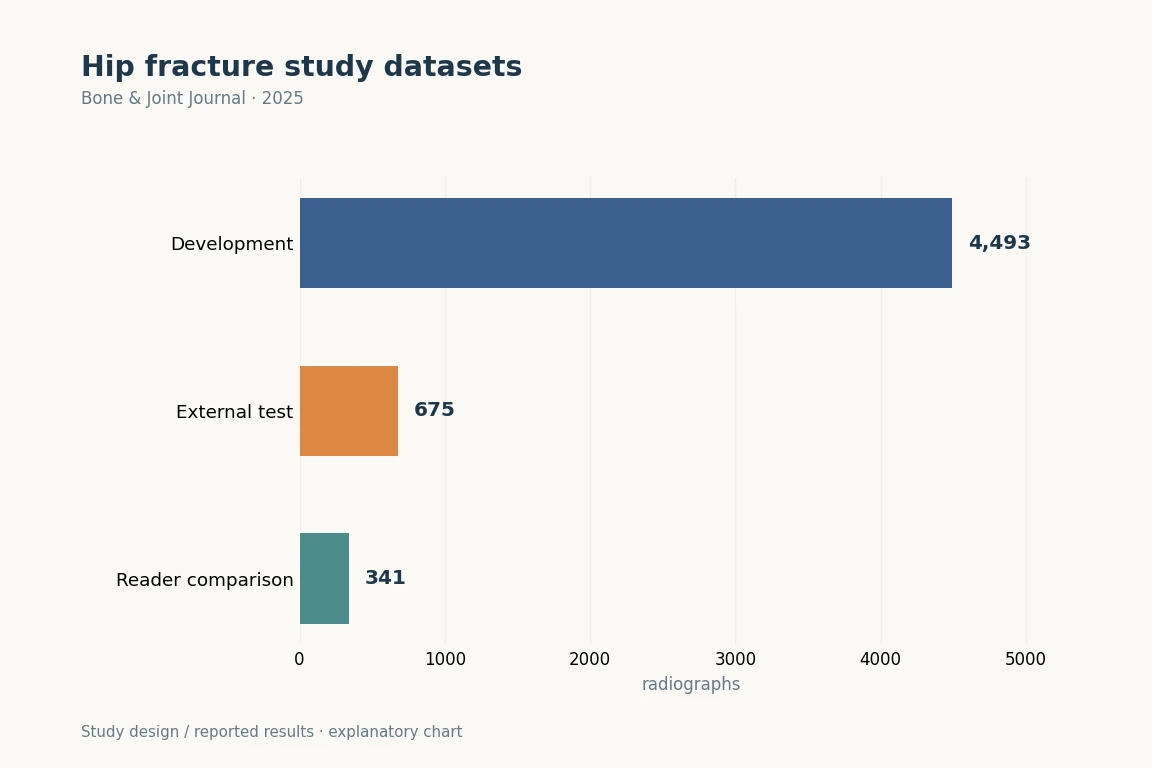
Development used 4,493 images from two institutions; external validation used 675 images from another institution.

Abstract · Original text

Zhiqian Zheng, Byeong Y Ryu, Sung E Kim, Dae S Song, Seong H Kim, Jung-Wee Park, Du H Ro. Deep learning for automated hip fracture detection and classification : achieving superior accuracy. The bone & joint journal. 2025;107-B(2):213-220. doi:10.1302/0301-620X.107B2.BJJ-2024-0791.R1.

AIMS

The aim of this study was to develop and evaluate a deep learning-based model for classification of hip fractures to enhance diagnostic accuracy.

METHODS

A retrospective study used 5,168 hip anteroposterior radiographs, with 4,493 radiographs from two institutes (internal dataset) for training and 675 radiographs from another institute for validation. A convolutional neural network (CNN)-based classification model was trained on four types of hip fractures (Displaced, Valgus-impacted, Stable, and Unstable), using DAMO-YOLO for data processing and augmentation. The model's accuracy, sensitivity, specificity, Intersection over Union (IoU), and Dice coefficient were evaluated. Orthopaedic surgeons' diagnoses served as the reference standard, with comparisons made before and after artificial intelligence assistance.

RESULTS

The accuracy, sensitivity, specificity, IoU, and Dice coefficients of the model for the four fracture categories in the internal dataset were as follows: Displaced (1.0, 0.79, 1.0, 0.70, 0.82), Valgus-impacted (1.0, 0.80, 1.0, 0.70, 0.82), Stable (0.99, 0.95, 0.99, 0.83, 0.89), and Unstable (1.0, 0.98, 0.99, 0.86, 0.92), respectively. For the external validation dataset, the sensitivity and specificity were as follows: Displaced (0.83, 0.94), Valgus-impacted (0.89, 0.90), Stable (0.88, 0.95), and Unstable (0.85, 0.99), respectively. The overall means (Micro AVG and Macro AVG) for the external dataset were Micro AVG (0.83 (SD 0.05), 0.96 (SD 0.01)) and Macro AVG (0.69 (SD 0.02), 0.95 (SD 0.02)), respectively.

CONCLUSION

Compared to human diagnosis alone, our study demonstrates that the developed model significantly improves the accuracy of detecting and classifying hip fractures. Our model has shown great potential in assisting clinicians with the accurate diagnosis and classification of hip fractures.


Keywords

  • Hip Fractures
  • Deep Learning
  • Retrospective Studies
  • Sensitivity and Specificity
  • Neural Networks, Computer
  • Radiography
  • Aged, 80 and over
  • AI
2025Explanatory illustration
TKACPAKconstitutional alignment

Do CPAK Distribution, aHKA, and JLO Differ with OA Severity?

As KL increased, the most frequent CPAK type shifted from II to I (P < 0.05). LDFA and JLCA increased; HKAA, MPTA and aHKA decreased beyond KL 2.

Abstract · Original text

Sung Eun Kim, Samuel MacDessi, Daeseok Song, Joong Il Kim, Byung Sun Choi, Hyuk-Soo Han, Du Hyun Ro. Coronal Plane Alignment of the Knee (CPAK) Type Shifts Toward Constitutional Varus with Increasing Kellgren and Lawrence Grade: A Radiographic Analysis of 17,365 Knees. The Journal of bone and joint surgery. American volume. 2025;107(3):297-303. doi:10.2106/JBJS.24.00316.

BACKGROUND

Studies investigating constitutional alignment across various grades of osteoarthritis (OA) are limited. This study explored the distribution of Coronal Plane Alignment of the Knee (CPAK) types and associated radiographic parameters with increasing OA severity.

METHODS

In this retrospective cross-sectional study, 17,365 knees were analyzed using deep learning software for radiographic measurements. Knees were categorized on the basis of the Kellgren and Lawrence (KL) grade and CPAK type. Radiographic measurements were the hip-knee-ankle angle (HKAA), lateral distal femoral angle (LDFA), medial proximal tibial angle (MPTA), arithmetic HKAA (aHKA), joint line obliquity (JLO), and joint line convergence angle (JLCA). Age-stratified analysis was performed to differentiate the impact of age on OA severity.

RESULTS

A shift in the most common CPAK type from II to I was found with increasing KL grade (p < 0.05). Furthermore, there was a corresponding increase in LDFA and JLCA with increasing KL grade, while HKAA, MPTA, and aHKA decreased after KL grade 2. Age exhibited limited association with LDFA and MPTA, suggesting that OA severity is the dominant factor related to the CPAK distribution.

CONCLUSIONS

The study found a shift in CPAK type with worsening OA. It is possible that constitutional varus types are more susceptible to OA, or that their increased OA prevalence is related to anatomical changes. This analysis offers new insights into alterations in CPAK type that occur with OA and underscores the importance of understanding pre-arthritic anatomy when performing joint reconstruction.

LEVEL OF EVIDENCE

Prognostic Level III . See Instructions for Authors for a complete description of levels of evidence.

Keywords

  • Osteoarthritis, Knee
  • Knee Joint
  • Retrospective Studies
  • Cross-Sectional Studies
  • Radiography
  • Severity of Illness Index
  • TKA
  • CPAK

Copyright © 2024 The Author(s). Published by The Journal of Bone and Joint Surgery, Incorporated.

Selection flow for OAI development and MOST testing. Final analyses included 900 and 453 people with unilateral OA.
ROC curves in validation and independent testing. MOST test AUC was 0.69 for contralateral OA onset.SHAP analysis of nine predictors. Baseline lateral joint space narrowing in the other knee was an important predictor.
2025Original figures and charts
contralateral kneeOAmachine learning

Can We Predict Contralateral KL ≥2 in Patients with Unilateral OA?

Contralateral OA developed in 172/900 OAI participants (19.1%) and 178/453 MOST participants (39.3%).

Abstract · Original text

Ji-Sahn Kim, Byung Sun Choi, Sung Eun Kim, Yong Seuk Lee, Do Weon Lee, Du Hyun Ro. Machine learning-based prediction of contralateral knee osteoarthritis development using the Osteoarthritis Initiative and the Multicenter Osteoarthritis Study dataset. Journal of orthopaedic research : official publication of the Orthopaedic Research Society. 2025;43(3):576-585. doi:10.1002/jor.26018.

Having osteoarthritis in one knee is reported as an independent risk factor for developing contralateral knee osteoarthritis (KOA). However, no study has been designed to predict the development of contralateral KOA (cKOA). The authors hypothesized that specific risk factors for cKOA development exist and that it could be accurately predicted with the assistance of machine learning. KOA was defined using the Kellgren-Lawrence grade (KLG) of 2 or higher. Data from 1353 unilateral KOA patients (900 from the Osteoarthritis Initiative [OAI] and 453 from the Multicenter Osteoarthritis Study [MOST]) over 4-5 years of follow-up were examined. The risk factors for cKOA development were analyzed, and a machine learning model was developed to predict cKOA using OAI as the development data set and MOST as the test data set. cKOA developed in 172 (19.1%) and 178 (39.3%) of the patients (OAI and MOST, respectively) over a period of 4-5 years. A machine learning model was developed using the Tree-based Pipeline Optimization Tool algorithm. This model utilized nine variables, including baseline lateral joint space narrowing grade of the contralateral knee (odds ratio 4.475). The area under the curve of the receiver operating characteristics curve, along with accuracy, precision, and F1-score, were recorded as 0.69, 0.60, 0.50, and 0.58, respectively, in the test data set. The development of cKOA could be effectively predicted using a limited number of variables through machine learning. Surgeons should consider the development of cKOA in patients with identified risk factors when managing KOA patients.

Keywords

  • knee
  • machine learning
  • osteoarthritis
  • risk factor
  • Osteoarthritis, Knee
  • Machine Learning
  • Risk Factors
  • contralateral knee
Spinopelvic measurement example from CONNEVO SPIN product materials
2025Original figures and charts
Imaging AISpinePelvic parameters

Can Pelvic and Lumbar Angles Be Measured Automatically on Radiographs of a Laterally Curved Spine?

Repeat-measurement ICC was 1.00 for every angle. Agreement with reference measurements and cross-validation ICCs were 0.96–0.99.

Abstract · Original text

Dong-Ho Kang, Ye-Jin Jeong, Sung Taeck Kim, Younguk Kim, Bong-Soon Chang, Hyoungmin Kim, Sam Yeol Chang, Du Hyun Ro. Automated measurement of pelvic parameters using convolutional neural network in complex spinal deformities: overcoming challenges in coronal deformity cases. The spine journal : official journal of the North American Spine Society. 2025;25(8):1688-1697. doi:10.1016/j.spinee.2025.01.020.

BACKGROUND CONTEXT

Accurate and consistent measurement of sagittal alignment is challenging, particularly in patients with severe coronal deformities, including degenerative lumbar scoliosis (DLS).

PURPOSE

This study aimed to develop and validate an artificial intelligence (AI)-based system for automating the measurement of key sagittal parameters, including lumbar lordosis, pelvic incidence, pelvic tilt, and sacral slope, with a focus on its applicability across a wide range of deformities, including severe coronal deformities, such as DLS.

DESIGN

Retrospective observational study.

PATIENT SAMPLE

A total of 1,011 standing lumbar lateral radiographs, including DLS.

OUTCOME MEASURE

Interclass and intraclass correlation coefficients (CC), and Bland-Altman plots.

METHODS

The model utilizes a deep-learning framework, incorporating a U-Net for segmentation and a Keypoint Region-based Convolutional Neural Network for keypoint detection. The ground truth masks were annotated by an experienced orthopedic specialist. The performance of the model was evaluated against ground truth measurements and assessments from two expert raters using interclass and intraclass CC, and Bland-Altman plots.

RESULTS

In the test set of 113 patients, 39 (34.5%) had DLS, with a mean Cobb's angle of 14.8°±4.4°. The AI model achieved an intraclass CC of 1.00 across all parameters, indicating perfect consistency. Interclass CCs comparing the AI model to ground truth ranged from 0.96 to 0.99, outperforming experienced orthopedic surgeons. Bland-Altman analysis revealed no significant systemic bias, with most differences falling within clinically acceptable ranges. A 5-fold cross-validation further demonstrated robust performance, with interclass CCs ranging from 0.96 to 0.99 across diverse subsets.

CONCLUSION

This AI-based system offers a reliable and efficient automated measurement of sagittal parameters in spinal deformities, including severe coronal deformities. The superior performance of the model compared with that of expert raters highlights its potential for clinical applications.

Keywords

  • Artificial intelligence
  • Convolutional neural network
  • Coronal deformity
  • Keypoint detection
  • Pelvic parameter
  • Sagittal alignment
  • Segmentation
  • Neural Networks, Computer
2025Explanatory illustration
AISPINLSTV

Can lumbosacral transitional vertebrae be detected automatically on lateral X-rays?

Test AUC was 0.84, sensitivity 85.1%, specificity 61.9% and accuracy 76.4%.

Abstract · Original text

Donghyuk Kwak, Du Hyun Ro, Dong-Ho Kang. Automated Detection of Lumbosacral Transitional Vertebrae on Plain Lumbar Radiographs Using a Deep Learning Model. Journal of clinical medicine. 2025;14(21):7671. doi:10.3390/jcm14217671.

Background/Objectives: Lumbosacral transitional vertebra (LSTV) is a common anatomical variant, but its identification on plain radiographs is often inconsistent. This inconsistency can lead to clinical complications such as chronic low back pain, misinterpretation of spinal parameters, and an increased risk of wrong-level surgery. This study aimed to develop and validate a deep learning-based artificial intelligence (AI) model for the automated detection of LSTV on plain lumbar radiographs. Methods: This retrospective observational study included a total of 3116 standing lumbar lateral radiographs. The presence or absence of lumbosacral transitional vertebra (LSTV) was definitively established using whole-spine imaging, CT, or MRI. Multiple deep learning architectures, including DINOv2, CLIP (ViT-B/32), and ResNet-50, were initially evaluated for binary classification of LSTV. Among these, the ResNet-50 model with partial fine-tuning achieved the best test performance and was subsequently selected for fivefold cross-validation using the training set. Model performance was assessed using accuracy, sensitivity, specificity, and the area under the receiver operating characteristic curve (AUROC), and interpretability was evaluated using gradient-weighted class activation mapping (Grad-CAM). Results: On the independent test set of 313 radiographs, the final model demonstrated robust diagnostic performance. It achieved an accuracy of 76.4%, a sensitivity of 85.1%, a specificity of 61.9%, and an AUC of 0.84. The model correctly identified 166 out of 195 LSTV cases and 73 out of 118 normal cases. Conclusions: This AI-based system offers a highly accurate and reliable method for the automated detection of LSTV on plain radiographs. It shows strong potential as a clinical decision-support tool to reduce diagnostic errors, improve pre-operative planning, and enhance patient safety.

Keywords

  • artificial intelligence
  • automated detection
  • convolutional neural network
  • deep learning
  • lumbosacral transitional vertebrae
  • plain radiograph
  • spine imaging
  • AI

© 2025 by the authors.

2025Research Diagram
ACLrevision surgeryallograft

What Are the Stability, Return-to-sport, and Retear Outcomes of QTPB Allografts in Revision ACL Reconstruction?

KOOS, IKDC, Lysholm and Tegner scores improved significantly at 2 years; 35/38 patients (92.1%) returned to sport.

Abstract · Original text

Do Weon Lee, Sanguk Lee, Du Hyun Ro, Hyuk-Soo Han. Satisfactory Clinical Outcomes of Revision Anterior Cruciate Ligament Reconstruction Using Quadriceps Tendon-Patellar Bone Allograft. Clinics in orthopedic surgery. 2025;17(1):91-99. doi:10.4055/cios23409.

BACKGROUD

Allografts are preferred in certain cases of revision anterior cruciate ligament reconstructions to avoid additional graft harvesting and to fill in enlarged tunnels. The clinical outcomes of quadriceps tendon-patellar bone allograft in revision anterior cruciate ligament reconstruction are not well-known. This study was performed to evaluate the clinical outcomes of revision anterior cruciate ligament reconstructions using quadriceps tendon-patellar bone allografts.

METHODS

Patients who underwent revision anterior cruciate ligament reconstructions with quadriceps tendon-patellar bone allografts with a minimum follow-up of 2 years were retrospectively reviewed. Their mean follow-up length was 33.5 ± 19.5 months. Outcomes including clinical scores (Lysholm, International Knee Documentation Committee [IKDC], Tegner scale, and Knee injury and Osteoarthritis Outcome Score [KOOS]), knee stability (physical examinations and knee arthrometer), return to sports, and any associated complications were assessed. Degrees of graft synovialization were also evaluated using arthroscopy.

RESULTS

A total of 38 patients were reviewed and their age at the time of surgery and follow-up length were 37.2 ± 12.5 years (range, 17-66 years) and 2.8 ± 1.6 years, respectively. All clinical scores including KOOS, IKDC, Lysholm, and Tegner scale significantly improved at 2 years after surgery and 92.1% of the patients returned to sports. The mean preoperative side-to-side difference in knee arthrometer decreased from 4.5 ± 2.3 mm before surgery to 2.6 ± 1.5 mm after surgery (p < 0.001). Graft synovialization was observed in 13 of 16 patients (81.3%) who underwent second-look arthroscopy. Complication rate was 10.5% (n = 4). All complications were graft re-rupture and occurred at an average of 18 months after revision surgery.

CONCLUSIONS

Quadriceps tendon-patellar bone allograft showed satisfactory clinical outcomes in revision anterior cruciate ligament reconstruction and thus could be a good alternative when autograft harvesting is not optimal.

Keywords

  • Anterior cruciate ligament
  • Anterior cruciate ligament reconstruction
  • Quadriceps muscle
  • Anterior Cruciate Ligament Reconstruction
  • Anterior Cruciate Ligament Injuries
  • Bone-Patellar Tendon-Bone Grafting
  • Retrospective Studies
  • Young Adult

Copyright © 2025 by The Korean Orthopaedic Association

2024Original figures and charts
TKAPROMsWOMAC

Are the Final Postoperative Score and the Amount of Improvement the Same Question?

Adjusted R² values for 1-year WOMAC pain, stiffness and function scores were 0.017, 0.036 and 0.078. For change-score models, they were 0.881, 0.755 and 0.761, respectively.

Abstract · Original text

Sung Eun Kim, Du Hyun Ro, Myung Chul Lee, Hyuk-Soo Han. Can individual functional improvements be predicted in osteoarthritic patients after total knee arthroplasty? Knee surgery & related research. 2024;36(1):31. doi:10.1186/s43019-024-00238-1.

PURPOSE

Total knee arthroplasty (TKA) is an effective treatment for advanced osteoarthritis, and achieving optimal outcomes can be challenging due to various influencing factors. Previous research has focused on identifying factors that affect postoperative functional outcomes. However, there is a paucity of studies predicting individual postoperative improvement following TKA. Therefore, a quantitative prediction model for individual patient outcomes is necessary.

MATERIALS AND METHODS

Demographic data, radiologic variables, intraoperative variables, and physical examination findings were collected from 976 patients undergoing TKA. Preoperative and 1-year postoperative Western Ontario and McMaster Universities Osteoarthritis Index (WOMAC) scores were assessed, and multivariate regression analysis was conducted to identify significant factors influencing one-year WOMAC scores and changes in WOMAC scores. A predictive model was developed on the basis of the findings.

RESULTS

The predictive accuracy of the model for 1-year WOMAC scores was poor (all adjusted R2 < 0.08), whereas the model for changes in WOMAC scores demonstrated strong predictability (all adjusted R2 > 0.75). Preoperative WOMAC scores, sex, and postoperative knee range of motion significantly affected all pain, stiffness, and physical function aspects of the WOMAC scores (all P < 0.05). Age, cerebrovascular disease, and patellar resurfacing were associated with changes in physical function (all P < 0.05).

CONCLUSIONS

The developed quantitative model demonstrated high accuracy in predicting changes in WOMAC scores after TKA. The identified factors influencing postoperative improvement in WOMAC scores can assist in optimizing patient outcomes after TKA.

Keywords

  • Functional improvement
  • Knee arthroplasty
  • Predictive model
  • WOMAC
  • TKA
  • PROMs
  • prediction
  • range of motion

© The Author(s) 2024

2024Original figures and charts
OAEMGgait

Can Lower-leg and Thigh Muscle Coactivation during Walking Estimate WOMAC and VAS Symptoms in Advanced OA?

The abstract reported an R² of 0.85 for the cross-validated WOMAC estimation model.

Abstract · Original text

Iqram Hussain, Sung Eun Kim, Chiheon Kwon, Seo Kyung Hoon, Hee Chan Kim, Yunseo Ku, Du Hyun Ro. Estimation of patient-reported outcome measures based on features of knee joint muscle co-activation in advanced knee osteoarthritis. Scientific reports. 2024;14(1):12428. doi:10.1038/s41598-024-63266-7.

Electromyography (EMG) is considered a potential predictive tool for the severity of knee osteoarthritis (OA) symptoms and functional outcomes. Patient-reported outcome measures (PROMs), such as the Western Ontario and McMaster Universities Osteoarthritis Index (WOMAC) and visual analog scale (VAS), are used to determine the severity of knee OA. We aim to investigate muscle activation and co-contraction patterns through EMG from the lower extremity muscles of patients with advanced knee OA patients and evaluate the effectiveness of an interpretable machine-learning model to estimate the severity of knee OA according to the WOMAC (pain, stiffness, and physical function) and VAS using EMG gait features. To explore neuromuscular gait patterns with knee OA severity, EMG from rectus femoris, medial hamstring, tibialis anterior, and gastrocnemius muscles were recorded from 84 patients diagnosed with advanced knee OA during ground walking. Muscle activation patterns and co-activation indices were calculated over the gait cycle for pairs of medial and lateral muscles. We utilized machine-learning regression models to estimate the severity of knee OA symptoms according to the PROMs using muscle activity and co-contraction features. Additionally, we utilized the Shapley Additive Explanations (SHAP) to interpret the contribution of the EMG features to the regression model for estimation of knee OA severity according to WOMAC and VAS. Muscle activity and co-contraction patterns varied according to the functional limitations associated with knee OA severity according to VAS and WOMAC. The coefficient of determination of the cross-validated regression model is 0.85 for estimating WOMAC, 0.82 for pain, 0.85 for stiffness, and 0.85 for physical function, as well as VAS scores, utilizing the gait features. SHAP explanation revealed that greater co-contraction of lower extremity muscles during the weight acceptance and swing phases indicated more severe knee OA. The identified muscle co-activation patterns may be utilized as objective candidate outcomes to better understand the severity of knee OA.
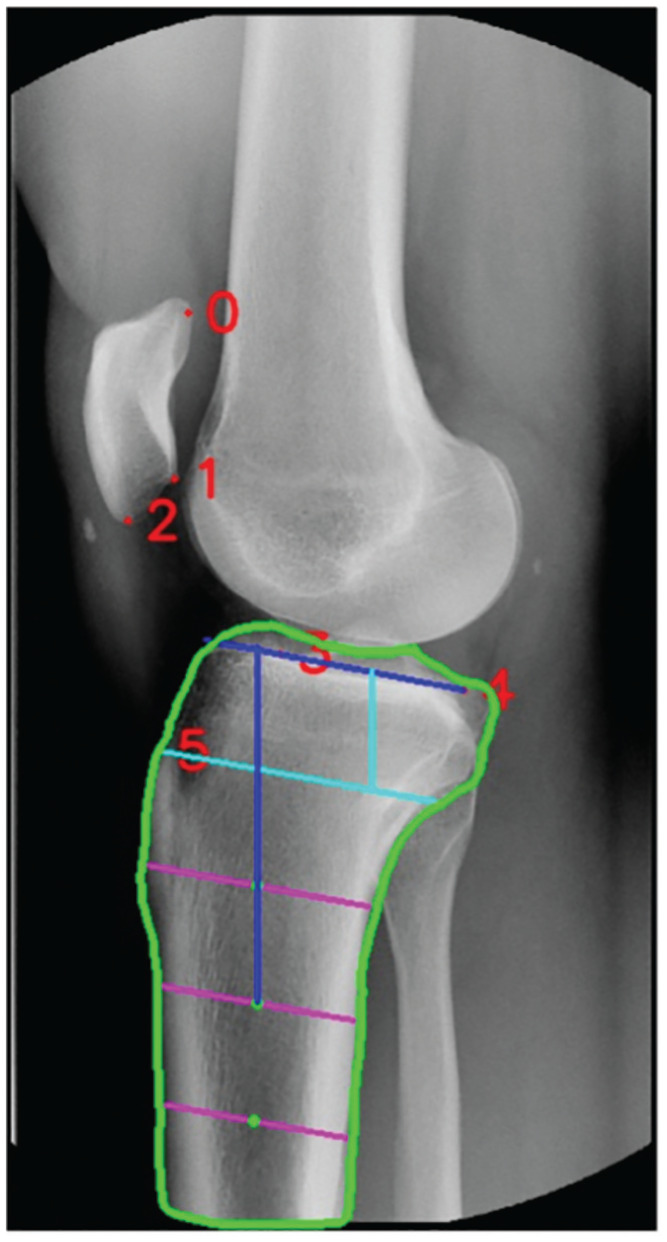
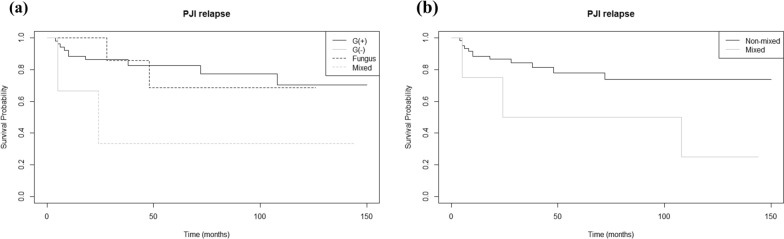
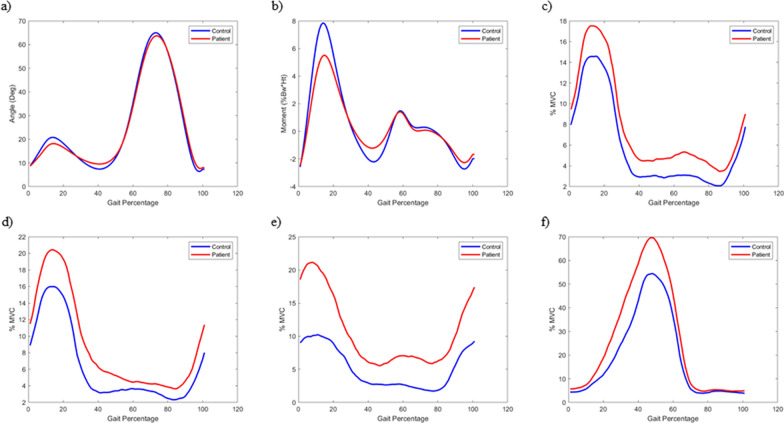
Keywords

  • Co-contraction index
  • Electromyography
  • Knee osteoarthritis
  • Machine-learning
  • WOMAC
  • Osteoarthritis, Knee
  • Patient Reported Outcome Measures
  • Knee Joint

© The Author(s) 2024

Staining, histology scores and functional measures in a mouse DMM osteoarthritis model.
2024Original figures and charts
OAcartilagesenescence

Could Selectively Identifying and Removing Senescent Chondrocytes with DPP-4 Reduce OA Progression?

SA-β-gal positivity was observed in approximately 57% of human OA chondrocytes.
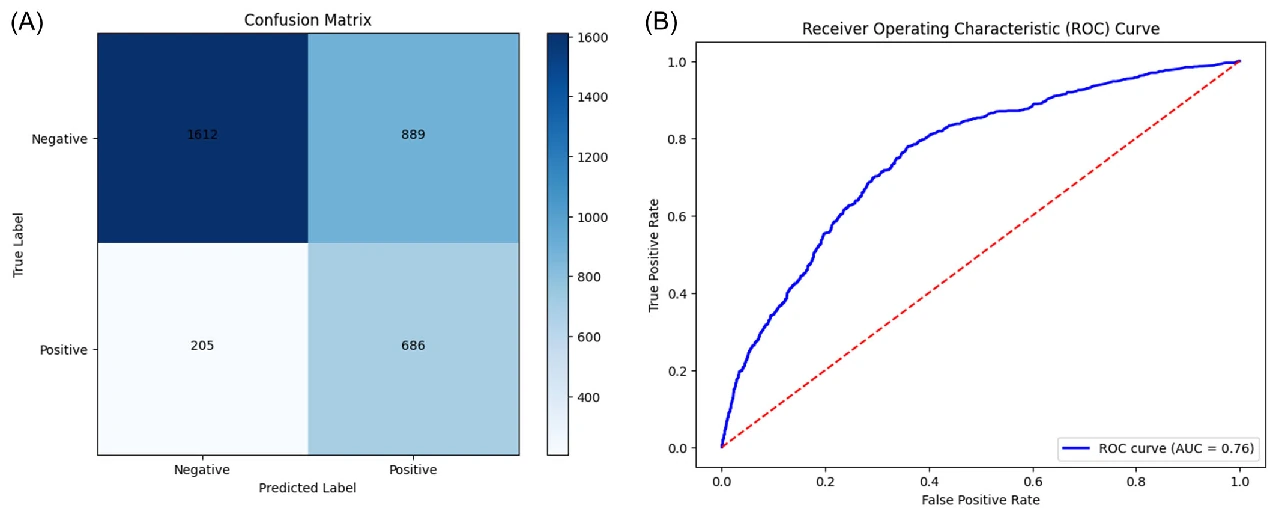
Abstract · Original text

Du Hyun Ro, Gun Hee Cho, Ji Yoon Kim, Seong Ki Min, Ha Ru Yang, Hee Jung Park, Sun Young Wang, You Jung Kim, Myung Chul Lee, Hyun Cheol Bae, Hyuk-Soo Han. Selective targeting of dipeptidyl-peptidase 4 (DPP-4) positive senescent chondrocyte ameliorates osteoarthritis progression. Aging cell. 2024;23(7):e14161. doi:10.1111/acel.14161.

Senescent cells increase in many tissues with age and induce age-related pathologies, including osteoarthritis (OA). Senescent chondrocytes (SnCs) are found in OA cartilage, and the clearance of those chondrocytes prevents OA progression. However, targeting SnCs is challenging due to the absence of a senescent chondrocyte-specific marker. Therefore, we used flow cytometry to screen and select senescent chondrocyte surface markers and cross-validated with published transcriptomic data. Chondrocytes expressing dipeptidyl peptidase-4 (DPP-4), the selected senescent chondrocyte-specific marker, had multiple senescence phenotypes, such as increased senescence-associated-galactosidase, p16, p21, and senescence-associated secretory phenotype expression, and showed OA chondrocyte phenotypes. To examine the effects of DPP-4 inhibition on DPP-4+ SnCs, sitagliptin, a DPP-4 inhibitor, was treated in vitro. As a result, DPP-4 inhibition selectively eliminates DPP-4+ SnCs without affecting DPP-4- chondrocytes. To assess in vivo therapeutic efficacy of targeting DPP-4+ SnCs, three known senolytics (ABT263, 17DMAG, and metformin) and sitagliptin were comparatively verified in a DMM-induced rat OA model. Sitagliptin treatment specifically and effectively eliminated DPP-4+ SnCs, compared to the other three senolytics. Furthermore, Intra-articular sitagliptin injection to the rat OA model increased collagen type II and proteoglycan expression and physical functions and decreased cartilage destruction, subchondral bone plate thickness and MMP13 expression, leading to the amelioration of OA phenotypes. Collectively, OARSI score was lowest in the sitagliptin treatment group. Taken together, we verified DPP-4 as a surface marker for SnCs and suggested that the selective targeting of DPP-4+ chondrocytes could be a promising strategy to prevent OA progression.
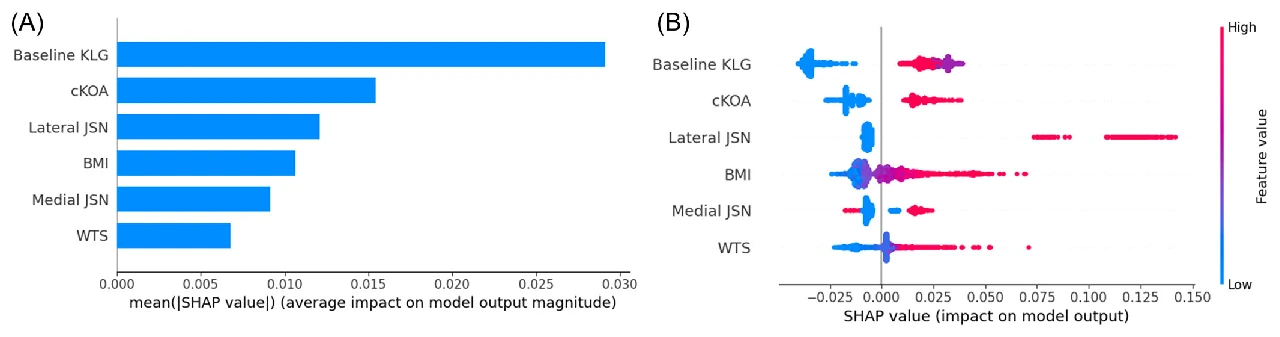
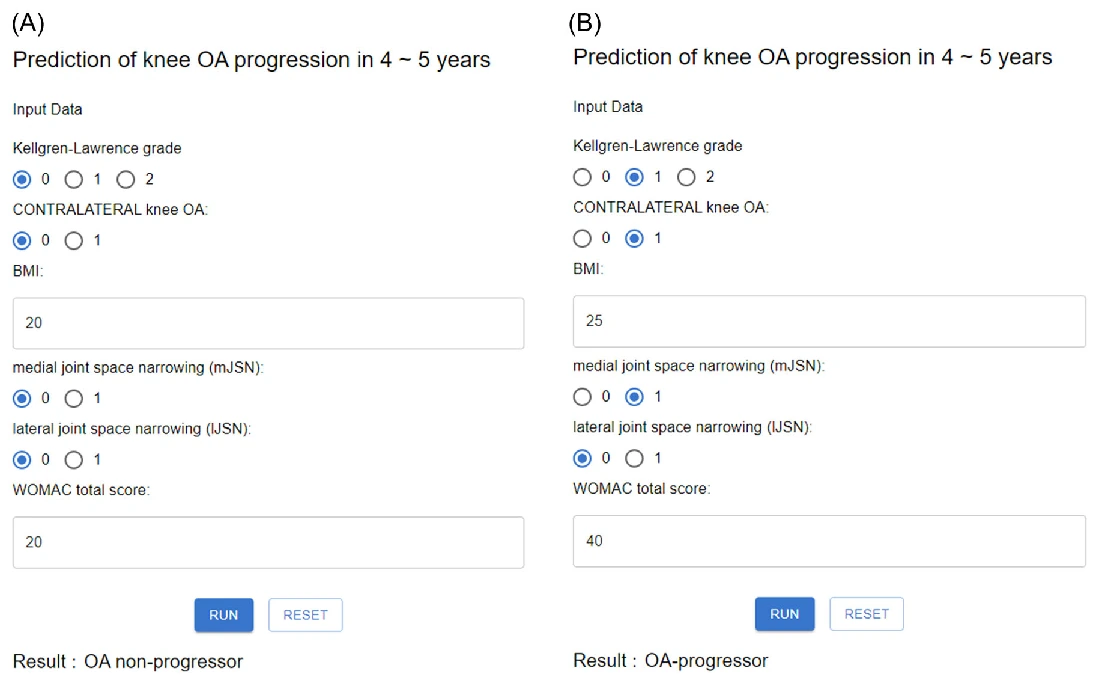
Keywords

  • dipeptidyl peptidase 4
  • osteoarthritis
  • senescence
  • senolytics
  • sitagliptin
  • Chondrocytes
  • Osteoarthritis
  • Dipeptidyl Peptidase 4

© 2024 The Authors. Aging Cell published by Anatomical Society and John Wiley & Sons Ltd.

2024Original figures and charts
patellofemoral jointskyline radiographLaurin view

Does a ±5° Beam-angle Difference Change Skyline PFJ Measurements, and Can the Anterior Tibial Border Guide Imaging?

Sulcus angle, congruence angle, patellar tilt, lateral facet angle and bisect ratio did not differ significantly across beam angles (all P > 0.05).

Abstract · Original text

Sung Eun Kim, Sunghyun Hwang, Ji Han Lee, Geunwu Gimm, Hyuk-Soo Han, Byung Sun Choi, Du Hyun Ro. Minimal impact of beam projection angle deviations in skyline (Laurin) view and the efficacy of the anterior border of proximal tibia as a guiding landmark. Skeletal radiology. 2024;53(7):1399-1406. doi:10.1007/s00256-024-04619-1.

OBJECTIVE

Obtaining an optimal knee skyline view is challenging due to inaccuracies in beam projection angles (BPAs) and soft tissue obscuring bony landmarks. This study aimed to assess the impact of BPA deviations on patellofemoral index measurements and assessed the anterior border of the proximal tibia as an anatomic landmark for guiding BPAs.

MATERIALS AND METHODS

This retrospective study consisted of three parts. The first was a simulation study using 52 CT scans of knees with a 20° flexion contracture to replicate the skyline (Laurin) view. Digitally reconstructed radiographs simulated neutral, 5° downward, and 5° upward tilt BPAs. Five patellofemoral indices (sulcus angle, congruence angle, patellar tilt angle, lateral facet angle, and bisect ratio) were measured and compared. The second part was a proof of concept study on 162 knees to examine patellar indices differences across these BPAs. Lastly, the alignment of the anterior border of the proximal tibia with the BPA tangential to the patellar articular surface was tested from the CT scans.

RESULTS

No significant differences in patellofemoral indices were found across various BPAs in both the simulation and proof of concept studies (all p > 0.05). The angle between the anterior border of the proximal tibia and the patellar articular surface was 1.5 ± 5.3°, a statistically significant (p = 0.037) yet clinically acceptable deviation.

CONCLUSION

Patellofemoral indices in skyline view remained consistent regardless of BPA deviations. The anterior border of the proximal tibia proved to be an effective landmark for accurate beam projection.

Keywords

  • Anterior border of proximal tibia
  • Beam projection angle
  • Deviation
  • Laurin view
  • Skyline view
  • Tibia
  • Tomography, X-Ray Computed
  • Retrospective Studies

© The Author(s) 2024

We use 3D CT to reconstruct the shape of the bow and take a steady axis and compare pieces at different heights. It's a way of describing where is narrower than the classification that you see in a side photo.
It's a basic diagram that compares how the gradient pattern changes when the angles of the intersection change. If the measurement position is different, then an indicator with the same name can produce a different value.
2024Original figures and charts
PFJtrochlear dysplasiaCT

Can TEA-based 3D CT Measurements Quantify Trochlear Dysplasia?

TG-TEA and MP-MEC were greater in the trochlear dysplasia group in the 0°, 15°, and 30° planes (all P < 0.05).

Abstract · Original text

Joon Young Lee, Sung Eun Kim, Oh Hyo Kwon, Youngjun Kim, Tae-Geun Son, Hyuk-Soo Han, Du Hyun Ro. Shallow trochlear groove and narrow medial trochlear width at the proximal trochlea in patients with trochlear dysplasia: A three-dimensional computed tomography analysis. Knee surgery, sports traumatology, arthroscopy : official journal of the ESSKA. 2024;32(6):1434-1445. doi:10.1002/ksa.12166.

PURPOSE

Although the Dejour classification is the primary classification system for evaluating trochlear dysplasia, concerns have been raised about its reliability owing to its qualitative criteria and challenges associated with obtaining accurate radiographs. This study aimed to quantify trochlear dysplasia using three-dimensional (3D) computed tomography (CT) reconstruction with novel parameters related to the transepicondylar axis (TEA).

METHODS

Sixty patients were enrolled, including 20 with trochlear dysplasia and 40 healthy controls. The 3D CT model was generated using the Materialise Interactive Medical Image Control System software. The following six parameters were measured in eight consecutive planes at 15° intervals (planes 0-105): the distance from the TEA to the most cortical point of the lateral condyle ('LP-TEA', where LP stands for lateral peak), medial condyle ('MP-TEA', MP for medial peak) and deepest point of the trochlea ('TG-TEA', TG for trochlear groove). The distances from the medial epicondyle (MEC) to the corresponding TEA points were measured ('LP-MEC', 'MP-MEC' and 'TG-MEC').

RESULTS

In the dysplasia group, TG-TEA (planes 0, 15 and 30) and MP-MEC (planes 0, 15 and 30) were significantly greater than those in the control group (all p < 0.05 for planes of TG-TEA and MP-MEC). For type A dysplasia, LP-MEC (plane 0) was greater than that in the control group. For type B dysplasia, the MP-MEC (planes 0 and 15) and TG-TEA (planes 0 and 15) were greater than those of the control group. For type D dysplasia, MP-MEC (planes 0, 15 and 30) and TG-TEA (planes 0 and 15) were elevated.

CONCLUSION

The 3D CT reconstruction analysis established a reproducible method for quantifying osseous trochlear morphology. Patients with trochlear dysplasia had a shallow TG and narrow medial trochlear width at tracking angles of 0°-30°. This finding corroborates the clinical manifestations of recurrent patellar instability that occur during early flexion.

LEVEL OF EVIDENCE

Level III.

Keywords

  • quantitative parameter
  • three‐dimensional reconstruction
  • trochlear dysplasia
  • trochlear groove
  • trochlear morphology
  • Imaging, Three-Dimensional
  • Tomography, X-Ray Computed
  • Young Adult
2024Original figures and charts
TKAPFJpatellar dislocation

What Are the Outcomes of TKA with Pathology-specific Additional Procedures for End-stage OA and Neglected Patellar Dislocation?

The KSS knee score changed from 36.7 → 88.3, the function score from 35.0 → 85.5, WOMAC from 52.8 → 14.3, and ROM from 112.1° → 125.0°.

Abstract · Original text

Sung Eun Kim, Seong Hwan Kim, Jung-In Lee, Hyuk-Soo Han, Myung Chul Lee, Du Hyun Ro. Primary Total Knee Arthroplasty for Treating Osteoarthritic Knees with Neglected Patellar Dislocation. Medicina (Kaunas, Lithuania). 2024;60(9):1492. doi:10.3390/medicina60091492.

Background and Objectives: Neglected patellar dislocation in the presence of end-stage osteoarthritis (OA) is a rare condition characterized by the patella remaining laterally dislocated without reduction. Due to the scarcity of reported cases, the optimal management approach is still uncertain. However, primary total knee arthroplasty (TKA) can serve as an effective treatment option. This study aimed to present the clinical and radiological outcomes achieved using our surgical technique. Materials and Methods: A retrospective review of 12 knees in 8 patients with neglected patellar dislocation and end-stage OA who underwent primary TKA was conducted. The surgical procedure involved conventional TKA techniques (e.g., medial parapatellar arthrotomy) and additional procedures specific to the individual pathologies of neglected patellar dislocation (e.g., lateral release, medial plication, and quadriceps lengthening). Clinical outcomes, including patient-reported outcome measures (PROMs) (Knee Society Scores and the Western Ontario and McMaster Universities Osteoarthritis Index) and knee range of motion (ROM), were assessed preoperatively and two years postoperatively. Radiological measures including mechanical femorotibial angle and patellar tilt angle were assessed preoperatively and until the last follow-up examinations. Any complications were also reviewed. Results: There were significant improvements in all PROMs, knee ROM, and radiological outcomes, including mechanical femorotibial angle and patellar tilt angle (all p < 0.05). At a mean follow-up of 68 months, no major complications requiring revision surgery, including patellar dislocation, were reported. Conclusions: Primary TKA is an effective procedure for correcting various pathologies associated with neglected patellar dislocation in end-stage OA without necessitating additional bony procedures. Satisfactory clinical and radiological outcomes can be expected using pathology-specific procedures.

Keywords

  • neglected patellar dislocation
  • osteoarthritis
  • outcomes
  • total knee arthroplasty
  • Arthroplasty, Replacement, Knee
  • Osteoarthritis, Knee
  • Patellar Dislocation
  • Retrospective Studies

© 2024 by the authors.

2024Original figures and charts
AITKAsurgical planning

Can X-rays Help Plan the Size of a Knee Implant in Advance?

Exact size agreement was 39.5% for the femur and 43.2% for the tibia. Agreement within one size was 88.9% for both.

Abstract · Original text

Jaeseok Park, Sung Eun Kim, Back Kim, Sanggyu Lee, Jae-Jun Lee, Du Hyun Ro. A deep learning based automatic two-dimensional digital templating model for total knee arthroplasty. Knee surgery & related research. 2024;36(1):38. doi:10.1186/s43019-024-00240-7.

BACKGROUND

Preoperative templating is an important step for total knee arthroplasty (TKA), facilitating hospital personnel in the anticipation and preparation of necessary surgical resources. Despite its importance, this process currently lacks automation. This study aimed to develop an artificial intelligence (AI) model to automate implant size prediction.

METHODS

A total of 13,281 (2938 anteroposterior, 10,343 lateral) knee radiographs obtained from the authors' institute were utilized for model training, with 2302 (1034 anteroposterior, 1268 lateral) images set apart for validation and testing. The templating AI model integrates a pipeline composed of multiple steps for automated implant size estimation. To predict implant size, anterioposterior (AP) and lateral radiograph predictions were merged, selecting the smaller of the predicted sizes to prevent implant overhang. The model's size predictions were validated with 81 real TKA data set apart from the training data, and its accuracy was compared to that of manual templating by an orthopedic specialist. Predictions matching the actual implanted sizes were labeled "exact" and those within one size, "accurate." The influence of patient characteristics on the model's prediction accuracy was also analyzed. The measurement time elapsed for implant sizing was recorded for both the AI model and the orthopedic specialist. Implant position predicted by the model was validated by comparing insert locations with postoperative images.

RESULTS

Compared with data from 81 actual TKA procedures, the model provided exact predictions for 39.5% of femoral and 43.2% of tibial components. Allowing a one-size margin of error, 88.9% of predictions were deemed "accurate" for both components. Interobserver reliability (Cohen's kappa) were 0.60 and 0.70 for femoral and tibial implants, respectively, both classified as "substantial." The orthopedic specialist produced results accurate within one-size margin of error in 95.1% and 100% of cases for femoral and tibial components, respectively. Interobserver reliability between the orthopedic specialist and ground truth was 0.76 and 0.8 for femoral and tibial components, respectively. The measurement time per case was 48.7 s for the AI model, compared with 97.5 s for the orthopedic specialist. Compared with postoperative radiographs, predicted implant position had an error of less than 4 mm on average.

CONCLUSIONS

An AI-based templating tool for TKA was successfully developed, demonstrating satisfactory accuracy and efficiency. Its application could significantly reduce the clinical workload in TKA preparation.

Keywords

  • Artificial intelligence
  • Implant size prediction
  • Preoperative templating
  • Total knee arthroplasty
  • AI
  • TKA
  • surgical planning
  • implant templating

© The Author(s) 2024

2024Explanatory illustration
HTOJLCAcontralateral knee

Which Imaging Measures Are Related to Progression and Future Surgery in the Operated and Contralateral Knees after Unilateral HTO?

Smaller postoperative JLCA was associated with greater risk of contralateral OA progression (P = 0.027) and surgery (P = 0.006). Larger JLCA was associated with greater risk of OA progression (P = 0.014) and TKA (P = 0.027) on the operated side.

Abstract · Original text

Geunwu Gimm, Hyunjun Ji, Du Hyun Ro, Myung Chul Lee, Hyuk-Soo Han. Medial Joint Opening in the Operated Knee After Unilateral High Tibial Osteotomy: Risk of Osteoarthritis and Future Surgery in the Operated and Nonoperated Knee. The American journal of sports medicine. 2024;52(13):3266-3276. doi:10.1177/03635465241285455.

BACKGROUND

High tibial osteotomy (HTO) modifies the mechanics of the affected knee but can also affect the nonoperated knee. However, no research has reported on the prognosis and risk factors related to the nonoperated knee after unilateral HTO.

PURPOSE

To assess the radiological parameters associated with osteoarthritis (OA) progression and the need for surgery in the nonoperated knee after unilateral HTO, with concurrent assessment of the operated knee.

STUDY DESIGN

Case series; Level of evidence, 4.

METHODS

The medical charts of 197 patients with knee OA who underwent unilateral HTO between March 2007 and December 2020 were retrospectively investigated. Radiological parameters such as the Kellgren-Lawrence grade, weightbearing line ratio, joint line convergence angle (JLCA), and joint line obliquity angle were assessed preoperatively and 1 year postoperatively.

RESULTS

The mean follow-up length for the 197 patients was 5.9 ± 3.2 years for the operated knee and 5.5 ± 3.2 years for the nonoperated knee. A smaller postoperative JLCA in the operated knee was a significant risk factor for OA progression (P = .027) and undergoing surgery (P = .006) in the nonoperated knee. Conversely, a larger postoperative JLCA in the operated knee was a significant risk factor for OA progression (P = .014) and conversion to arthroplasty (P = .027) in the operated knee. A postoperative JLCA >1.5° (P < .001) and <3.9° (P < .001) was needed to reduce the risk of undergoing surgery in the nonoperated knee and OA progression in the operated knee, respectively. Additionally, a pre- to postoperative change in the JLCA (ΔJLCA) between -5.6° and -1.7° (P = .021 and P = .004, respectively) was needed to reduce the risk of OA progression in both knees.

CONCLUSION

A large medial joint opening (a small postoperative JLCA) in the operated knee after unilateral HTO was associated with a higher risk of OA progression and surgery in the nonoperated knee. Conversely, a small medial joint opening (a large postoperative JLCA) was associated with a higher risk of OA progression and conversion to arthroplasty in the operated knee. For a balanced medial joint opening, if the postoperative JLCA was between 1.5° and 3.9° or the ΔJLCA was between -5.6° and -1.7°, a favorable prognosis in both knees could be anticipated.

Keywords

  • conversion to arthroplasty
  • joint line convergence angle
  • nonoperated knee
  • osteoarthritis progression
  • surgery
  • unilateral high tibial osteotomy
  • Osteoarthritis, Knee
  • Osteotomy
2024Explanatory illustration
AIsports medicinereview

Which sports-medicine questions can machine learning and deep learning address?

Applications are divided into prognostic prediction from tabular clinical data, structural recognition on images and natural-language processing of operative records.

Abstract · Original text

Ayoosh Pareek, Du Hyun Ro, Jón Karlsson, R Kyle Martin. Machine learning/artificial intelligence in sports medicine: state of the art and future directions. Journal of ISAKOS : joint disorders & orthopaedic sports medicine. 2024;9(4):635-644. doi:10.1016/j.jisako.2024.01.013.

Machine learning (ML) is changing the way health care is practiced and recent applications of these novel statistical techniques have started to impact orthopaedic sports medicine. Machine learning enables the analysis of large volumes of data to establish complex relationships between "input" and "output" variables. These relationships may be more complex than could be established through traditional statistical analysis and can lead to the ability to predict the "output" with high levels of accuracy. Supervised learning is the most common ML approach for healthcare data and recent studies have developed algorithms to predict patient-specific outcome after surgical procedures such as hip arthroscopy and anterior cruciate ligament reconstruction. Deep learning is a higher-level ML approach that facilitates the processing and interpretation of complex datasets through artificial neural networks that are inspired by the way the human brain processes information. In orthopaedic sports medicine, deep learning has primarily been used for automatic image (computer vision) and text (natural language processing) interpretation. While applications in orthopaedic sports medicine have been increasing exponentially, one significant barrier to widespread adoption of ML remains clinician unfamiliarity with the associated methods and concepts. The goal of this review is to introduce these concepts, review current machine learning models in orthopaedic sport medicine, and discuss future opportunities for innovation within the specialty.

Keywords

  • Artificial intelligence
  • Deep learning
  • Machine learning
  • Orthopaedic surgery
  • Predictive models
  • Sports medicine
  • Machine Learning
  • Sports Medicine
2024Original figures and charts
AIKOAKL

Can similar OA grades be distinguished more precisely?

Overall KL classification accuracy was 75.7%. This was five-category classification of grades 0–4.

Abstract · Original text

Do Weon Lee, Dae Seok Song, Hyuk-Soo Han, Du Hyun Ro. Accurate, automated classification of radiographic knee osteoarthritis severity using a novel method of deep learning: Plug-in modules. Knee surgery & related research. 2024;36(1):24. doi:10.1186/s43019-024-00228-3.

BACKGROUND

Fine-grained classification deals with data with a large degree of similarity, such as cat or bird species, and similarly, knee osteoarthritis severity classification [Kellgren-Lawrence (KL) grading] is one such fine-grained classification task. Recently, a plug-in module (PIM) that can be integrated into convolutional neural-network-based or transformer-based networks has been shown to provide strong discriminative regions for fine-grained classification, with results that outperformed the previous deep learning models. PIM utilizes each pixel of an image as an independent feature and can subsequently better classify images with minor differences. It was hypothesized that, as a fine-grained classification task, knee osteoarthritis severity may be classified well using PIMs. The aim of the study was to develop this automated knee osteoarthritis classification model.

METHODS

A deep learning model that classifies knee osteoarthritis severity of a radiograph was developed utilizing PIMs. A retrospective analysis on prospectively collected data was performed. The model was trained and developed using the Osteoarthritis Initiative dataset and was subsequently tested on an independent dataset, the Multicenter Osteoarthritis Study (test set size: 17,040). The final deep learning model was designed through an ensemble of four different PIMs.

RESULTS

The accuracy of the model was 84%, 43%, 70%, 81%, and 96% for KL grade 0, 1, 2, 3, and 4, respectively, with an overall accuracy of 75.7%.

CONCLUSIONS

The ensemble of PIMs could classify knee osteoarthritis severity using simple radiographs with a fine accuracy. Although improvements will be needed in the future, the model has been proven to have the potential to be clinically useful.

Keywords

  • Classification
  • Deep learning
  • Knee osteoarthritis
  • AI
  • KOA
  • KL
  • external validation

© The Author(s) 2024, corrected publication 2025

2024Original figures and charts
AIMetricalignment

Can lower-limb alignment be measured consistently across hospitals with different equipment and imaging protocols?

Inter-observer ICC against specialist measurements was 0.936–0.997. Repeated measurements of the same image had ICC 1.000.

Abstract · Original text

Sung Eun Kim, Jun Woo Nam, Joong Il Kim, Jong-Keun Kim, Du Hyun Ro. Enhanced deep learning model enables accurate alignment measurement across diverse institutional imaging protocols. Knee surgery & related research. 2024;36(1):4. doi:10.1186/s43019-023-00209-y.

BACKGROUND

Achieving consistent accuracy in radiographic measurements across different equipment and protocols is challenging. This study evaluates an advanced deep learning (DL) model, building upon a precursor, for its proficiency in generating uniform and precise alignment measurements in full-leg radiographs irrespective of institutional imaging differences.

METHODS

The enhanced DL model was trained on over 10,000 radiographs. Utilizing a segmented approach, it separately identified and evaluated regions of interest (ROIs) for the hip, knee, and ankle, subsequently integrating these regions. For external validation, 300 datasets from three distinct institutes with varied imaging protocols and equipment were employed. The study measured seven radiologic parameters: hip-knee-ankle angle, lateral distal femoral angle, medial proximal tibial angle, joint line convergence angle, weight-bearing line ratio, joint line obliquity angle, and lateral distal tibial angle. Measurements by the model were compared with an orthopedic specialist's evaluations using inter-observer and intra-observer intraclass correlation coefficients (ICCs). Additionally, the absolute error percentage in alignment measurements was assessed, and the processing duration for radiograph evaluation was recorded.

RESULTS

The DL model exhibited excellent performance, achieving an inter-observer ICC between 0.936 and 0.997, on par with an orthopedic specialist, and an intra-observer ICC of 1.000. The model's consistency was robust across different institutional imaging protocols. Its accuracy was particularly notable in measuring the hip-knee-ankle angle, with no instances of absolute error exceeding 1.5 degrees. The enhanced model significantly improved processing speed, reducing the time by 30-fold from an initial 10-11 s to 300 ms.

CONCLUSIONS

The enhanced DL model demonstrated its ability for accurate, rapid alignment measurements in full-leg radiographs, regardless of protocol variations, signifying its potential for broad clinical and research applicability.

Keywords

  • Accuracy
  • Alignment measurement
  • Deep learning
  • Full-leg radiographs
  • Imaging protocol
  • AI
  • Metric
  • alignment

© The Author(s) 2024

2024Explanatory illustration
meniscusrepairbone marrow aspirate

What recovery was observed after adding bone marrow aspirate to horizontal or radial meniscal repair?

Healing on three-month MRI was 60%. Pain and function scores improved at two years compared with baseline.

Abstract · Original text

Byung Sun Choi, Juneseok Won, Hyuk-Soo Han. Augmentation with Bone Marrow Aspirate Harvested from the Iliac Crest for Horizontal or Radial Meniscal Tears Yields Favorable Healing Rates in Magnetic Resonance Imaging and Clinical Outcomes. Clinics in Orthopedic Surgery. 2024. doi:10.4055/cios23213.

Excerpt from the original abstract

As the importance of meniscus in joint function becomes more apparent, there is a growing interest in meniscus repair techniques.…

Keywords

  • Bone marrow cell
  • Bone marrow aspirate
  • Meniscus
  • Arthroscopy
  • meniscus
  • repair
  • bone marrow aspirate
2024Research Diagram
revision TKAinstabilitypolyethylene exchange

Do Survival and Clinical Outcomes of Isolated Polyethylene Insert Exchange for TKA Instability Differ with Hyperextension?

Overall IPIE survival was 83% at 5 years and 57% at 10 years. Survival did not differ significantly according to the presence of hyperextension.

Abstract · Original text

Byung Sun Choi, Du Hyun Ro, Myung Chul Lee, Hyuk-Soo Han. Isolated Polyethylene Insert Exchange for Instability after Total Knee Arthroplasty: Comparable Survival Rates and Range of Motion and Improved Clinical Scores Regardless of Hyperextension. Clinics in orthopedic surgery. 2024;16(4):550-558. doi:10.4055/cios23163.

BACKGROUND

Isolated polyethylene insert exchange (IPIE) has not been established as a treatment option for hyperextension instability after primary total knee arthroplasty (TKA). The purpose of the study was to evaluate the survival rate and clinical outcomes of IPIE for the treatment of instability with or without hyperextension after TKA.

METHODS

This study retrospectively reviewed 46 patients who underwent IPIE for symptomatic prosthetic knee instability by dividing them into 2 groups based on the presence of hyperextension (without for group I and with for group IH). Patient demographics, clinical scores, radiographic data, range of motion (ROM), and surgical information were collected. Clinical failure was defined as a subsequent surgery following IPIE for any reason. The survival rate of IPIE and differences in demographics, clinical scores, and ROM were compared.

RESULTS

There were 46 patients (91% were women) with an average age of 70.1 years and a mean follow-up of 44.8 months. The average time between primary TKA and IPIE surgery was 6.5 ± 4.2 years, and during IPIE, 2 out of the 8 cruciate-retaining inserts were converted to "deep-dish" ultracongruent inserts while the insert thickness increased from 11.9 ± 1.8 mm to 17.1 ± 3.1 mm. After IPIE surgery, a significantly thicker tibial insert was used in the group with hyperextension (15.39 ± 2.4 mm for group I, 18.3 ± 2.9 mm for group IH; p < 0.001 by independent t-test), and no significant differences were observed in the ROM and clinical scores before and after IPIE between the 2 groups. The overall survival rate for IPIE was 83% at 5 years and 57% at 10 years, and there were no statistically significant differences between the groups using the Cox proportional hazards regression model.

CONCLUSIONS

IPIE demonstrated an overall survival rate of 83% at 5 years with no difference in the recurrence of instability regardless of hyperextension. This study highlighted the effectiveness of using thicker inserts to resolve instability without significant differences in the ROM or clinical scores between the groups, suggesting its potential as a decision-making reference for surgeons.

Keywords

  • Hyperextension
  • Isolated polyethylene insert exchange
  • Joint instability
  • Polyethylene
  • Reoperation
  • Arthroplasty, Replacement, Knee
  • Joint Instability
  • Range of Motion, Articular

Copyright © 2024 by The Korean Orthopaedic Association

2024Research Diagram
TKAfixed bearingposterior stabilized

How Is Satisfaction after PS TKA Related to Bearing Design, Postoperative Flexion, and Comorbidities?

There were 784 satisfied patients (91.4%) and 74 dissatisfied patients (8.6%).

Abstract · Original text

Sung Eun Kim, Byung Sun Choi, Du Hyun Ro, Myung Chul Lee, Hyuk-Soo Han. Fixed-Bearing and Higher Postoperative Knee Flexion Angle as Predictors of Satisfaction in Asian Patients Undergoing Posterior-Stabilized Total Knee Arthroplasty. Clinics in orthopedic surgery. 2024;16(5):733-740. doi:10.4055/cios23166.

BACKGROUND

Patient-reported satisfaction following total knee arthroplasty (TKA) can be affected by various factors. This study aimed to assess patient satisfaction rates and identify factors related to patients, surgery, and postoperative knee motion associated with satisfaction in posterior-stabilized TKA among Asian patients.

METHODS

A retrospective cross-sectional study was conducted in patients with primary osteoarthritis who underwent TKA and had a follow-up period of over 2 years. Patient satisfaction was measured using a 5-point Likert scale, and the patients were divided into satisfied and dissatisfied groups. The factors potentially affecting satisfaction were collected, including demographics, comorbidities, surgical options, and knee motion. Univariate and multivariate regression analyses were performed.

RESULTS

Of the 858 patients included, 784 (91.4%) were satisfied and 74 (8.6%) were dissatisfied. Fixed-bearing implants and higher postoperative knee flexion angles were associated with satisfaction (odds ratio [OR], 2.366; p = 0.001 and OR, 1.045; p < 0.001, respectively), whereas cerebrovascular disease was related to dissatisfaction (OR, 0.403; p = 0.005). The regression model demonstrated moderate predictability (R 2 = 0.112).

CONCLUSIONS

Fixed-bearing implants and higher postoperative knee flexion angles were associated with patient satisfaction following TKA, whereas cerebrovascular disease was associated with dissatisfaction. The identification of these factors could help improve surgical outcomes and patient satisfaction following TKA.

Keywords

  • Cerebrovascular disease
  • Fixed-bearing
  • Knee flexion angle
  • Patient satisfaction
  • Total knee arthroplasty
  • Arthroplasty, Replacement, Knee
  • Patient Satisfaction
  • Range of Motion, Articular

Copyright © 2024 by The Korean Orthopaedic Association

2024Research Diagram
TKAgaitprediction

Can Preoperative Characteristics Identify Patients Whose Walking Speed Will Increase or Decrease by at Least 10% after Bilateral TKA?

Mean walking speed increased by 0.07 m/s, from 0.87 to 0.94 m/s (P < 0.001).

Abstract · Original text

Do Weon Lee, Hyuk-Soo Han, Myung Chul Lee, Du Hyun Ro. Prediction of postoperative gait speed change after bilateral primary total knee arthroplasty in female patients using a machine learning algorithm. Orthopaedics & traumatology, surgery & research : OTSR. 2024;110(7):103842. doi:10.1016/j.otsr.2024.103842.

BACKGROUND

An important aim of total knee arthroplasty is to achieve functional recovery, which includes post-operative increase in walking speed. Therefore, predicting whether a patient will walk faster or slower after surgery is important in TKA, which has not been studied in previous literatures. Who walks faster and who walks slower after TKA? Can we predict these kinds of patients before surgery?

HYPOTHESIS

Whether or not a patient walk faster after total knee arthroplasty can be predicted with preoperative characteristics.

PATIENTS AND METHODS

In this retrospective cohort study, 128 female patients who underwent staged bilateral total knee arthroplasty were analyzed with gait analysis preoperatively and at postoperative two years. These patients were divided into three different groups according to the percentage of gait speed change after total knee arthroplasty: 1) V(+), more than 10% gait speed increase; 2) V(-), more than 10% gait speed decrease; and 3) V(0), those in-between. Gait parameters, mechanical axis angles, WOMAC pain score and Knee Society scores of the two groups (V(+) and V(-)) were compared. Furthermore, a classification model predicting whether a patient walks faster after total knee arthroplasty was designed using a machine learning algorithm.

RESULTS

After total knee arthroplasty, average gait speed increased by 0.07m/s from 0.87m/s to 0.94m/s (p<0.001) and gait speed increased in 43.8% of the patients (n=56). However, gait speed decreased in a significant number of patients (n=17, 13.3%). When V(+) and V(-) groups were compared, gait speed, cadence, sagittal/coronal knee range of motion, and Knee Society Function score were lower in the V(+) group before surgery, but became higher after surgery. Gait speed change could be predicted using three variables (preoperative gait speed, age, and the magnitude of mechanical axis angle). The area under the receiver operating characteristic curve of the machine learning model was 0.86.

DISCUSSION

After total knee arthroplasty, gait speed was maintained or increased in most patients. However, gait speed decreased in a significant number of patients. The machine learning classification model showed a good predictive performance, which could aid in the decision-making and the timing of total knee arthroplasty.

LEVEL OF EVIDENCE

III; retrospective cohort study.

Keywords

  • Gait analysis
  • Gait speed
  • Total knee arthroplasty
  • Arthroplasty, Replacement, Knee
  • Machine Learning
  • Walking Speed
  • Retrospective Studies
  • Recovery of Function
2024Research Diagram
TKApatellofemoral jointpatellar retention

Are the Grade and Location of Existing Patellar Cartilage Lesions Related to Outcomes of Mobile-bearing TKA without Patellar Resurfacing?

At every follow-up time point, PROMs did not differ significantly according to the grade or location of the cartilage lesion.

Abstract · Original text

Do Weon Lee, Du Hyun Ro, Hyuk-Soo Han, Myung Chul Lee. Patella Cartilage Status Does Not Affect the Clinical Outcomes of Non-resurfaced Patella in Mobile-Bearing Total Knee Arthroplasty. Clinics in orthopedic surgery. 2024;16(2):242-250. doi:10.4055/cios22253.

BACKGROUND

During total knee arthroplasty (TKA), patellar retention is performed when the cartilage is fairly well preserved and the thickness of the patella is relatively thin. However, clinical outcomes of the non-resurfaced patella in TKA according to the cartilage status are lacking in the literature. The purpose of this study was to compare patient-reported outcome measures (PROMs) according to the grade and location of the patellar cartilage lesion in TKA patients.

METHODS

The outcomes of 165 osteoarthritis patients (186 knees) who underwent cemented mobile-bearing TKA without patellar resurfacing were assessed and classified according to the grade and location of the patellar cartilage lesion. PROMs using the Western Ontario and MacMaster Universities Osteoarthritis index, the Knee Society Score (Knee Society Function Score and Knee Society Knee Score), and the Hospital for Special Surgery score were evaluated preoperatively and at postoperative 2, 4, 6, and 8 years. The correlations between PROMs and the grade and location of the cartilage lesion were assessed. Additionally, radiologic outcomes including the patellar tilt angle and patellar height were assessed and their correlation with the grade of cartilage lesion was analyzed. Analysis of variance was used to determine statistical significance.

RESULTS

There was no significant difference between PROMs according to the grades and locations of cartilage lesions at any postoperative follow-up. Radiologic parameters also showed no significant differences according to the grades of patellar cartilage lesions.

CONCLUSIONS

The grade and location of the patellar cartilage lesion had no influence on clinical outcomes in mobile-bearing TKA with patellar retention at short- and long-term follow-up.

Keywords

  • Articular cartilage
  • Patella
  • Total knee arthroplasty
  • Arthroplasty, Replacement, Knee
  • Osteoarthritis, Knee
  • Knee Prosthesis
  • Cartilage
  • Postoperative Period

Copyright © 2024 by The Korean Orthopaedic Association

2024Research Diagram
ACLrectangular tunnelQTPB

Can a Partial-thickness QTPB Autograft and Rectangular Tunnel Reduce Early Donor-site Morbidity Compared with a Round Tunnel in ACL Reconstruction?

Stability and clinical scores improved in both groups, with no significant postoperative difference between groups.

Abstract · Original text

Do Weon Lee, Du Hyun Ro, Myung Chul Lee, Hyuk-Soo Han. Rectangular-Tunnel Anterior Cruciate Ligament Reconstruction Using Quadriceps Tendon-Patellar Bone Autograft Can Reduce Early Donor Site Morbidity While Maintaining Comparable Short-term Clinical Outcomes. Clinics in orthopedic surgery. 2024;16(1):49-56. doi:10.4055/cios21264.

BACKGROUND

Rectangular tunnel and graft have been recently designed to closely resemble the native anatomy in anterior cruciate ligament reconstruction (ACLR). This study was performed to compare the short-term clinical outcomes between rectangular and round femoral tunnels in ACLR using quadriceps tendon-patellar bone (QTPB) autografts.

METHODS

A total of 78 patients who underwent primary ACLR with QTPB autografts performed by three senior surgeons and had at least 1 year of postoperative follow-up were retrospectively reviewed. Patients who underwent rectangular tunnel ACLR (n = 40) were compared to those treated with the conventional round tunnel ACLR (n = 38). Outcomes including knee stability, clinical scores, quadriceps strength, associated complications, postoperative knee range of motion, and cross-sectional area of the graft were assessed.

RESULTS

Significant improvements in knee stability and clinical scores were observed after surgery in both groups (all p < 0.001). The postoperative measurements of knee stability and clinical scores were not significantly different between the two groups. Knee extension strength deficit at 60°/sec was significantly less in the rectangular tunnel group than in the round tunnel group at postoperative 6 months (41.7% vs. 48.9%, p = 0.032). The cross-sectional area of the partial-thickness QTPB graft was approximately 60% of the full-thickness QTPB graft.

CONCLUSIONS

In the short-term, rectangular tunnel ACLR was comparable to round tunnel ACLR with QTPB autograft despite the smaller cross-sectional area. Additionally, the rectangular tunnel ACLR allowed partial-thickness grafting technique, which could subsequently reduce early donor site morbidity.

Keywords

  • Anterior cruciate ligament
  • Anterior cruciate ligament reconstruction
  • Quadriceps muscle
  • Anterior Cruciate Ligament Reconstruction
  • Anterior Cruciate Ligament Injuries
  • Autografts
  • Retrospective Studies
  • Knee Joint

Copyright © 2024 by The Korean Orthopaedic Association

2024Research Diagram
HTOJLCAsoft tissue laxity

Does Medial Joint Opening Explain PROMs after HTO Better Than Mechanical-axis Deviation?

PROMs were better in the group achieving medial joint opening (ΔJLCA >1° in the abstract; all P < 0.05).

Abstract · Original text

Sung E Kim, Junpyo Kwak, Du H Ro, Myung C Lee, Hyuk-Soo Han. The use of medial joint opening rather than mechanical axis deviation to determine the clinical outcomes after high tibial osteotomy. The bone & joint journal. 2024;106-B(3):240-248. doi:10.1302/0301-620X.106B3.BJJ-2023-0337.R3.

Excerpt from the original abstract

The aim of this study was to evaluate whether achieving medial joint opening, as measured by the change in the joint line convergence angle (∆JLCA),…

Keywords

  • Knee Joint
  • Osteoarthritis, Knee
  • Retrospective Studies
  • Tibia
  • Osteotomy
  • HTO
  • JLCA
  • soft tissue laxity
2024Research Diagram
HTOgaitposterior tibial slope

Do Opening-wedge and Closing-wedge HTO Produce Similar Gait Changes?

Varus correction did not differ between groups (P = 0.543). The opening-wedge group had higher PTS and a lower Blackburne–Peel ratio (both P < 0.001).

Abstract · Original text

Do Weon Lee, Hyuk-Soo Han, Du Hyun Ro. Comparative analysis of gait: Similar coronal but different sagittal effects between closing-wedge and opening-wedge high tibial osteotomy. Clinical biomechanics (Bristol, Avon). 2024;114:106238. doi:10.1016/j.clinbiomech.2024.106238.

BACKGROUND

High tibial osteotomy is an established surgical option for medial compartment osteoarthritis of the knee with varus alignment. It can be divided into open wedge and closing wedge by operative technique. Although they have fundamental differences, little is known about the biomechanical consequences of the two surgical methods.

METHODS

Thirty-eight patients with medial compartment osteoarthritis who underwent high tibial osteotomy (19 open-wedge and 19 closing-wedge) were retrospectively reviewed. Clinical scores and radiological measurements were assessed until postoperative two years. Gait analysis was performed preoperatively and again at postoperative one year.

FINDINGS

Varus alignment was corrected in both groups without a significant difference between them (p = 0.543). However, posterior tibial slope was higher, and the Blackburne-Peel ratio was lower in the open wedge osteotomy group after surgery (both p < 0.001). Reduction of dynamic knee varus and knee adduction moment were observed in both groups without significant differences. However, after surgery, average knee range of motion (63.3° vs 57.3°, p < 0.001) and the magnitude of knee flexion moment was significantly lower (p = 0.005) in the closing wedge group. There were no significant differences in the Kujala Anterior Knee Pain Scale and the occurrence of patellofemoral arthritis between the groups postoperatively.

INTERPRETATION

After osteotomy, a smaller average knee range of motion in the sagittal plane and a higher knee flexion moment were observed in the open wedge osteotomy group, suggesting quadriceps muscle avoidance. However, no differences in clinical scores or the short-term occurrence of patellofemoral arthritis were noted between the two surgical techniques.

Keywords

  • Closing wedge osteotomy
  • Gait analysis
  • High tibial osteotomy
  • Open wedge osteotomy
  • Osteoarthritis, Knee
  • Retrospective Studies
  • Treatment Outcome
  • Knee Joint
2023Original figures and charts
TKAroboticsblood management

Is Robot Use Associated with Transfusion Rates in Staged Bilateral TKA Performed One Week Apart?

The first surgery bleeding: 2/53 of the conventional troops, 3.8 percent; 1/53 in the robotic army, 1.9 percent; P=0.558.

Abstract · Original text

Jong Hwa Lee, Ho Jung Jung, Byung Sun Choi, Du Hyun Ro, Joong Il Kim. Effectiveness of Robotic Arm-Assisted Total Knee Arthroplasty on Transfusion Rate in Staged Bilateral Surgery. Journal of clinical medicine. 2023;12(14):4570. doi:10.3390/jcm12144570.

The transfusion rate in staged bilateral total knee arthroplasty (TKA) remains high despite the application of blood management techniques. The potential of robotic arm-assisted TKA (R-TKA) in reducing the transfusion rate in staged bilateral surgery has not yet been investigated. Therefore, we aimed to evaluate the effectiveness of R-TKA on transfusion reduction compared with conventional TKA (C-TKA) in staged bilateral surgery. This retrospective study involved two groups of patients who underwent 1-week interval staged bilateral TKA-the C-TKA group and the R-TKA group-using MAKO SmartRobotics (Stryker, Kalamazoo, MI, USA). Each group comprised 53 patients after propensity score matching and was compared in terms of nadir hemoglobin (Hb) level and transfusion rate after each stage of surgery. Both groups showed no significant differences in the propensity-matched variables of age, sex, body mass index, American Society of Anesthesiologists physical status score, and preoperative Hb level. The R-TKA group showed a significantly higher nadir Hb level than the C-TKA group after the second TKA (p = 0.002). The transfusion rate was not significantly different between the two groups after the first TKA (p = 0.558). However, the R-TKA group showed a significantly lower transfusion rate in the TKA (p = 0.030) and overall period (p = 0.023) than the C-TKA group. Patients who undergo staged bilateral R-TKA have lower transfusion rate than those who undergo C-TKA. R-TKA may be effective in minimizing unnecessary allogeneic transfusions in staged bilateral surgery.

Keywords

  • perioperative blood management
  • robotic arm-assisted total knee arthroplasty
  • staged bilateral total knee arthroplasty
  • total knee arthroplasty
  • transfusion
  • TKA
  • robotics
  • blood management

© 2023 by the authors.

2023Explanatory illustration
Imaging AIAlignmentHTO

Can Detecting 15 Landmarks on Full-length Lower-limb X-rays Reproduce Alignment Angles Automatically?

Angle-specific inter-observer ICCs for the automatic model were ≥0.98; repeat-measurement ICC was 1.00.

Abstract · Original text

Changwung Jo, Doohyun Hwang, Sunho Ko, Myung Ho Yang, Myung Chul Lee, Hyuk-Soo Han, Du Hyun Ro. Deep learning-based landmark recognition and angle measurement of full-leg plain radiographs can be adopted to assess lower extremity alignment. Knee surgery, sports traumatology, arthroscopy : official journal of the ESSKA. 2023;31(4):1388-1397. doi:10.1007/s00167-022-07124-x.

PURPOSE

Evaluating lower extremity alignment using full-leg plain radiographs is an essential step in diagnosis and treatment of patients with knee osteoarthritis. The study objective was to present a deep learning-based anatomical landmark recognition and angle measurement model, using full-leg radiographs, and validate its performance.

METHODS

A total of 11,212 full-leg plain radiographs were used to create the model. To train the data, 15 anatomical landmarks were marked by two orthopaedic surgeons. Mechanical lateral distal femoral angle (mLDFA), medial proximal tibial angle (MPTA), joint line convergence angle (JLCA), and hip-knee-ankle angle (HKAA) were then measured. For inter-observer reliability, the inter-observer intraclass correlation coefficient (ICC) was evaluated by comparing measurements from the model, surgeons, and students, to ground truth measurements annotated by an orthopaedic specialist with 14 years of experience. To evaluate test-retest reliability, all measurements were made twice by each measurer. Intra-observer ICCs were then derived. Performance evaluation metrics used in previous studies were also derived for direct comparison of the model's performance.

RESULTS

Inter-observer ICCs for all angles of the model were 0.98 or higher (p < 0.001). Intra-observer ICCs for all angles were 1.00, which was higher than that of the orthopaedic specialist (0.97-1.00). Measurements made by the model showed no significant systemic variation. Except for JLCA, angles were precisely measured with absolute error averages under 0.52 degrees and proportion of outliers under 4.26%.

CONCLUSIONS

The deep learning model is capable of evaluating lower extremity alignment with performance as accurate as an orthopaedic specialist with 14 years of experience.

LEVEL OF EVIDENCE

III, retrospective cohort study.

Keywords

  • Angle measurement
  • Deep learning
  • Hip knee ankle angle (HKAA)
  • Joint line convergence angle (JLCA)
  • Landmark recognition
  • Lower extremity
  • Mechanical lateral distal femoral angle (mLDFA)
  • Medial proximal tibial angle (MPTA)
2023Explanatory illustration
AIGANradiographs

Can synthetic X-rays reproduce osteoarthritis features?

StyleGAN2-ADA had FID 2.96 against real images. Experts' real-versus-generated discrimination accuracies were 34%, 43%, 44%, 57% and 50%.

Abstract · Original text

Gun Ahn, Byung Sun Choi, Sunho Ko, Changwung Jo, Hyuk-Soo Han, Myung Chul Lee, Du Hyun Ro. High-resolution knee plain radiography image synthesis using style generative adversarial network adaptive discriminator augmentation. Journal of orthopaedic research : official publication of the Orthopaedic Research Society. 2023;41(1):84-93. doi:10.1002/jor.25325.

In this retrospective study, 10,000 anteroposterior (AP) radiography of the knee from a single institution was used to create medical data set that are more balanced and cheaper to create. Two types of convolutional networks were used, deep convolutional GAN (DCGAN) and Style GAN Adaptive Discriminator Augmentation (StyleGAN2-ADA). To verify the quality of generated images from StyleGAN2-ADA compared to real ones, the Visual Turing test was conducted by two computer vision experts, two orthopedic surgeons, and a musculoskeletal radiologist. For quantitative analysis, the Fréchet inception distance (FID), and principal component analysis (PCA) were used. Generated images reproduced the features of osteophytes, joint space narrowing, and sclerosis. Classification accuracy of the experts was 34%, 43%, 44%, 57%, and 50%. FID between the generated images and real ones was 2.96, which is significantly smaller than another medical data set (BreCaHAD = 15.1). PCA showed that no significant difference existed between the PCs of the real and generated images (p > 0.05). At least 2000 images were required to make reliable images optimally. By performing PCA in latent space, we were able to control the desired PC that show a progression of arthritis. Using a GAN, we were able to generate knee X-ray images that accurately reflected the characteristics of the arthritis progression stage, which neither human experts nor artificial intelligence could discern apart from the real images. In summary, our research opens up the potential to adopt a generative model to synthesize realistic anonymous images that can also solve data scarcity and class inequalities.

Keywords

  • diagnostic imaging
  • knee
  • Artificial Intelligence
  • Arthritis
  • Retrospective Studies
  • Knee Joint
  • Radiography
  • AI
2023Explanatory illustration
meniscus rootSIFKOA

Which findings predict a poorer course after nonoperative treatment of a meniscal root tear?

Radiographic OA progressed in 34 patients (36%); 12 (13%) underwent arthroplasty during follow-up.

Abstract · Original text

Byung Sun Choi, Jeehyeok Chung, Junpyo Kwak, Hyuk-Soo Han. Subchondral insufficiency fracture is a predictive factor of osteoarthritis progression and conversion to arthroplasty in non-surgically treated medial meniscus root tear. KSSTA. 2023. doi:10.1007/s00167-023-07444-6.

Excerpt from the original abstract

To investigate the radiographic and clinical outcomes of non-surgical treatment for medial meniscus posterior root tear (MMPRT), and prognostic factors for osteoarthritis…

Keywords

  • Medial meniscus posterior root tear
  • Non-surgical treatment
  • Subchondral insufficiency fracture
  • meniscus root
  • SIFK
  • OA
  • prognosis
2023Explanatory illustration
alignmenthealthy populationTKA

Does alignment in people without osteoarthritis differ by age and sex?

Mean HKA was 178.01° in males and 178.82° in females. Mean MPTA in males was approximately 1° smaller.

Abstract · Original text

Doohyun Hwang, Min Wook Choi, Seong-Hwan Kim, Hyuk-Soo Han, Chong Bum Chang, Myung Chul Lee, Na-Kyoung Lee, Du Hyun Ro. Age and sex differences in coronal lower extremity alignment in a healthy Asian population. The Knee. 2023;45:198-206. doi:10.1016/j.knee.2023.09.009.

BACKGROUND

The purpose of this study was to analyze the coronal alignment of lower extremities according to age and sex in a healthy population and demonstrate the differences.

METHODS

Standing full-lower limb anteroposterior (AP) radiographs of healthy volunteers (670 males and 782 females) aged 18-69 years were retrospectively analyzed. The hip-knee-ankle angle (HKA), lateral distal femoral angle (LDFA), medial proximal tibial angle (MPTA), joint line convergence angle and femoral bowing angle (FBA) were measured. The radiographic parameters were compared according to groups of age and sex. The proportion of volunteers with varus or valgus alignment more than 3° were also analyzed.

RESULTS

With increasing age, HKA and LDFA varus increased. With increasing age, femoral medial bowing decreased. In addition, the HKA showed more varus alignment in males than in females (178.01° vs. 178.82°, P < 0.001). The MPTA was about 1° smaller in males than in females (P < 0.001). The proportion of patients with varus alignment of more than 3° increased with increasing age, with 16.9% in the 10-19 years old and 38.0% in the 60-69 years old groups.

CONCLUSION

This study demonstrated that males showed more varus tibial alignments than females. Varus limb alignment, LDFA, and FBA also increases with age. In contrast, tibial alignment was constant across all age groups. Therefore, differences in lower extremity alignment according to age and sex should be considered in estimating individual prearthritic alignments.

Keywords

  • Kinematic alignment
  • Lower limb alignment
  • Mechanical alignment
  • Normal alignment
  • Total knee arthroplasty
  • Genu Varum
  • Osteoarthritis, Knee
  • Child
2023Research Diagram
TKAroboticsfunctional alignment

Do Robotic Functional Alignment and Manual Mechanical Alignment Differ in Two-year PROMs and Component Alignment?

The robot-assisted FA group had better 2-year PROMs and satisfaction. The manual MA group had higher rates of femoral coronal and tibial sagittal outliers (P = 0.017 and 0.015).

Abstract · Original text

Byung Sun Choi, Sung Eun Kim, Myungho Yang, Du Hyun Ro, Hyuk-Soo Han. Functional alignment with robotic‑arm assisted total knee arthroplasty demonstrated better patient-reported outcomes than mechanical alignment with manual total knee arthroplasty. Knee surgery, sports traumatology, arthroscopy : official journal of the ESSKA. 2023;31(3):1072-1080. doi:10.1007/s00167-022-07227-5.

Excerpt from the original abstract

Given the improved accuracy of robot-assisted surgery, robotic-arm assisted functionally aligned total knee arthroplasty (RFA-TKA) aims to preserve the native pre-arthritic knee biomechanics, to achieve…

Keywords

  • Functional knee phenotype
  • Implant position
  • Patient-reported outcomes
  • Robotic-arm assisted total knee arthroplasty
  • Arthroplasty, Replacement, Knee
  • Robotic Surgical Procedures
  • Surgery, Computer-Assisted
  • Osteoarthritis, Knee
2022Original figures and charts
AIsarcopeniaTKA

Can muscle regions on full-leg X-rays screen for sarcopenia before surgery?

Test-set segmentation IoU was 0.926. PMV correlated with skeletal muscle index at 0.654.

Abstract · Original text

Doohyun Hwang, Sungho Ahn, Yong-Beom Park, Seong Hwan Kim, Hyuk-Soo Han, Myung Chul Lee, Du Hyun Ro. Deep Learning-Based Muscle Segmentation and Quantification of Full-Leg Plain Radiograph for Sarcopenia Screening in Patients Undergoing Total Knee Arthroplasty. Journal of clinical medicine. 2022;11(13):3612. doi:10.3390/jcm11133612.

Sarcopenia, an age-related loss of skeletal muscle mass and function, is correlated with adverse outcomes after some surgeries. Here, we present a deep-learning-based model for automatic muscle segmentation and quantification of full-leg plain radiographs. We illustrated the potential of the model to predict sarcopenia in patients undergoing total knee arthroplasty (TKA). A U-Net-based deep learning model for automatic muscle segmentation was developed, trained and validated on the plain radiographs of 227 healthy volunteers. The radiographs of 403 patients scheduled for primary TKA were reviewed to test the developed model and explore its potential to predict sarcopenia. The proposed deep learning model achieved mean IoU values of 0.959 (95% CI 0.959-0.960) and 0.926 (95% CI 0.920-0.931) in the training set and test set, respectively. The fivefold AUC value of the sarcopenia classification model was 0.988 (95% CI 0.986-0.989). Of seven key predictors included in the model, the predicted muscle volume (PMV) was the most important of these features in the decision process. In the preoperative clinical setting, wherein laboratory tests and radiographic imaging are available, the proposed deep-learning-based model can be used to screen for sarcopenia in patients with knee osteoarthritis undergoing TKA with high sarcopenia screening performance.

Keywords

  • deep learning
  • osteoarthritis
  • plain radiograph
  • sarcopenia
  • screening
  • segmentation
  • total knee arthroplasty
  • AI

© 2022 by the authors.

2022Original figures and charts
AIimplantTKA

Can different hardware and implants be detected automatically on postoperative knee X-rays?

External overall accuracy was 0.956, sensitivity 0.493 and specificity 0.975. High accuracy must be read alongside low sensitivity.

Abstract · Original text

Back Kim, Do Weon Lee, Sanggyu Lee, Sunho Ko, Changwung Jo, Jaeseok Park, Byung Sun Choi, Aaron John Krych, Ayoosh Pareek, Hyuk-Soo Han, Du Hyun Ro. Automated Detection of Surgical Implants on Plain Knee Radiographs Using a Deep Learning Algorithm. Medicina (Kaunas, Lithuania). 2022;58(11):1677. doi:10.3390/medicina58111677.

Background and Objectives: The number of patients who undergo multiple operations on a knee is increasing. The objective of this study was to develop a deep learning algorithm that could detect 17 different surgical implants on plain knee radiographs. Materials and Methods: An internal dataset consisted of 5206 plain knee antero-posterior X-rays from a single, tertiary institute for model development. An external set contained 238 X-rays from another tertiary institute. A total of 17 different types of implants including total knee arthroplasty, unicompartmental knee arthroplasty, plate, and screw were labeled. The internal dataset was approximately split into a train set, a validation set, and an internal test set at a ratio of 7:1:2. You Only look Once (YOLO) was selected as the detection network. Model performances with the validation set, internal test set, and external test set were compared. Results: Total accuracy, total sensitivity, total specificity value of the validation set, internal test set, and external test set were (0.978, 0.768, 0.999), (0.953, 0.810, 0.990), and (0.956, 0.493, 0.975), respectively. Means ± standard deviations (SDs) of diagonal components of confusion matrix for these three subsets were 0.858 ± 0.242, 0.852 ± 0.182, and 0.576 ± 0.312, respectively. True positive rate of total knee arthroplasty, the most dominant class of the dataset, was higher than 0.99 with internal subsets and 0.96 with an external test set. Conclusion: Implant identification on plain knee radiographs could be automated using a deep learning technique. The detection algorithm dealt with overlapping cases while maintaining high accuracy on total knee arthroplasty. This could be applied in future research that analyzes X-ray images with deep learning, which would help prompt decision-making in clinics.

Keywords

  • automated detection
  • deep learning
  • detection algorithm
  • Deep Learning
  • Arthroplasty, Replacement, Knee
  • Radiography
  • Algorithms
  • Knee Joint

© 2022 by the authors.

2022Explanatory illustration
AIclassificationobject detection

Does an orthopaedic imaging question require classification, detection or segmentation?

It distinguishes classifying whether a meniscal tear exists, detecting its location with a box and segmenting precise structural boundaries.

Abstract · Original text

Sunho Ko, Ayoosh Pareek, Du Hyun Ro, Yining Lu, Christopher L Camp, R Kyle Martin, Aaron J Krych. Artificial intelligence in orthopedics: three strategies for deep learning with orthopedic specific imaging. Knee surgery, sports traumatology, arthroscopy : official journal of the ESSKA. 2022;30(3):758-761. doi:10.1007/s00167-021-06838-8.

No abstract is listed for this article.

Keywords

  • Deep Learning
  • Orthopedic Procedures
  • Orthopedics
  • Artificial Intelligence
  • Machine Learning
  • AI
  • classification
  • object detection