R.Du Hyun RoOrthopedics & Research
Text

RESEARCH STORIES

Papers from our group,
explained clearly.

We study ways to assess osteoarthritis using consistent criteria, record changes quantitatively, and predict its course. Papers on knee alignment and imaging AI are explained alongside their original figures.

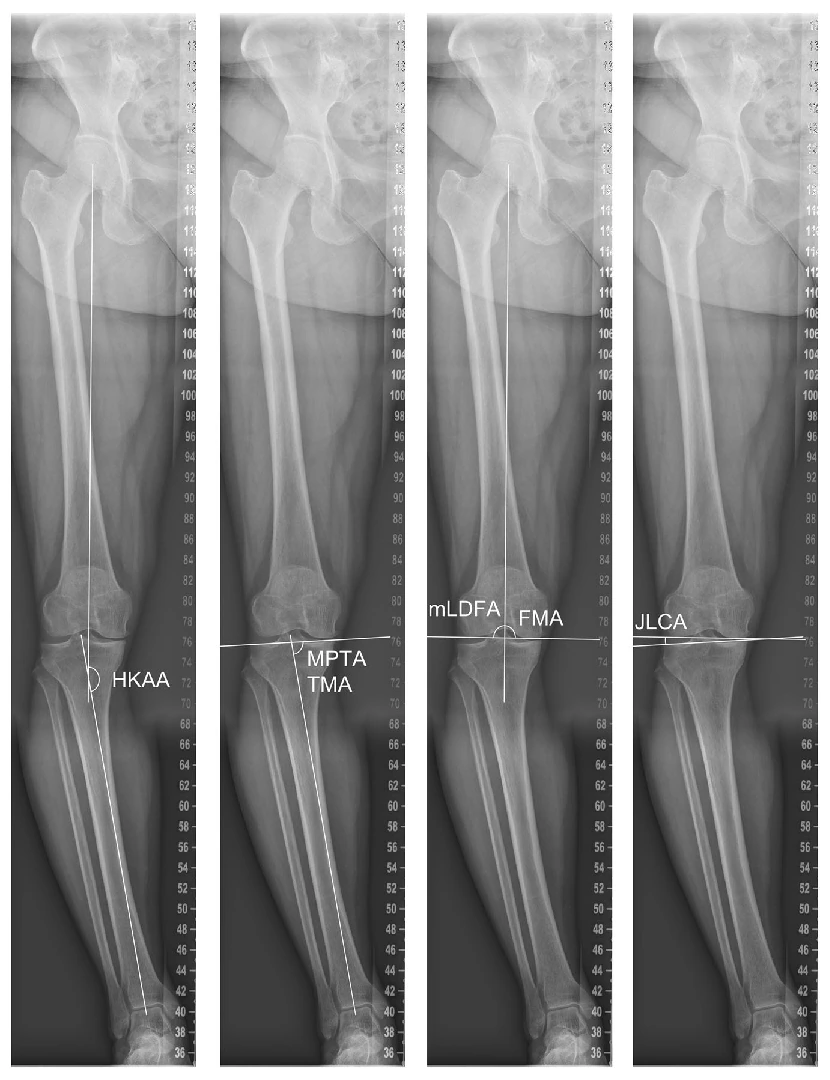
Original standing long-leg radiographs illustrate alignment measurements, including the whole-leg axis and joint line.
2026 · knee shape and change · Figures and explanation

How much does bowleg alignment change over time?

The speed at which knee swings in and out was not the same.

Drawing and research
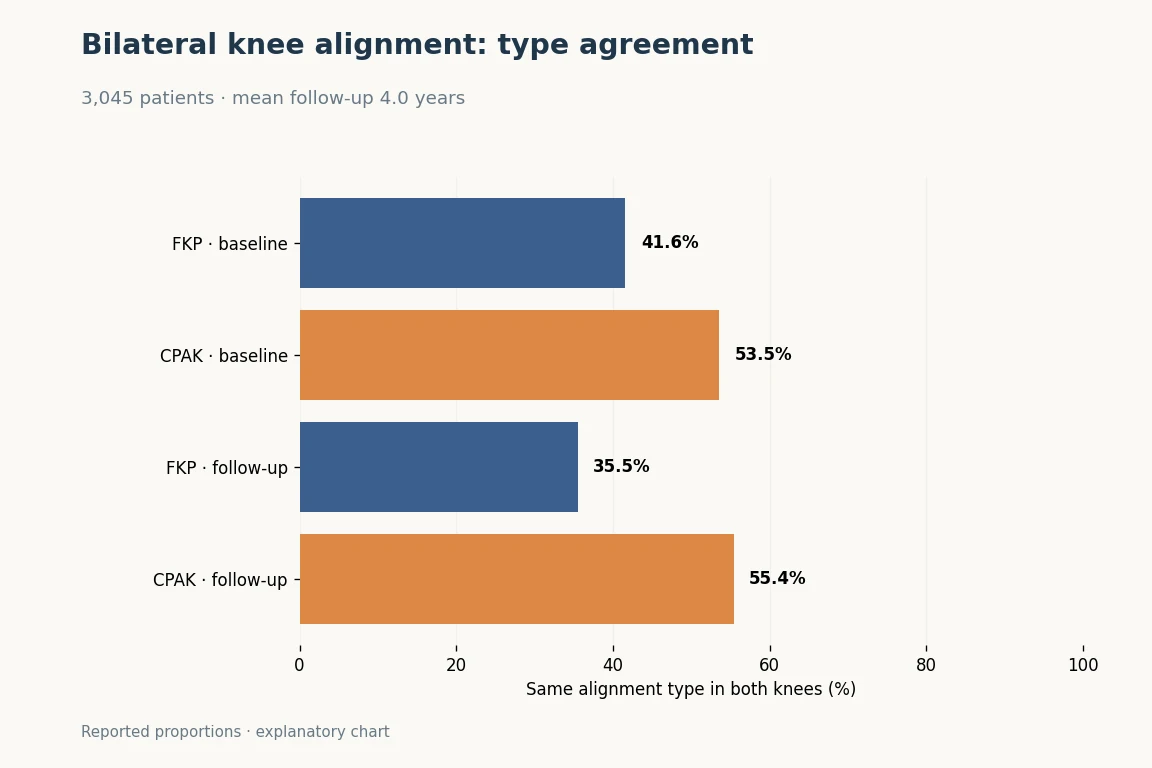
Bilateral FKP and CPAK agreement at baseline and follow-up
2026 · knee shape and change · Figures and explanation

Do both knees change in similar ways?

The knee’s own baseline condition was more strongly associated with alignment change than the opposite knee’s condition.

Drawing and research
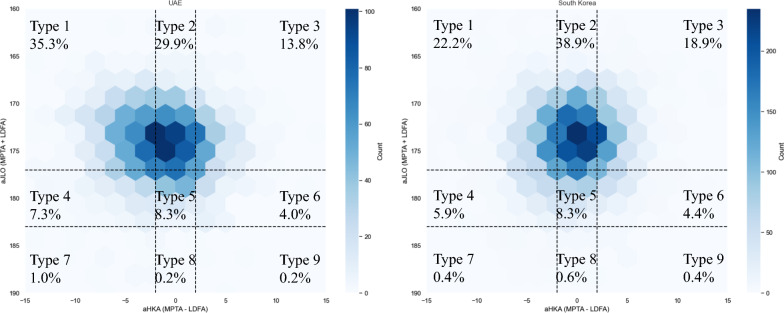
The AHKA and joint line slope of the JLO distribution in UAE and South Korea patients is shown above CPAK zone Figure 2.
2025 · knee shape and change · Figures and explanation

Does knee alignment differ between people and countries?

When we compared hospital visitors from South Korea and the UAE, there was a slightly different sort of common knee.

Drawing and research
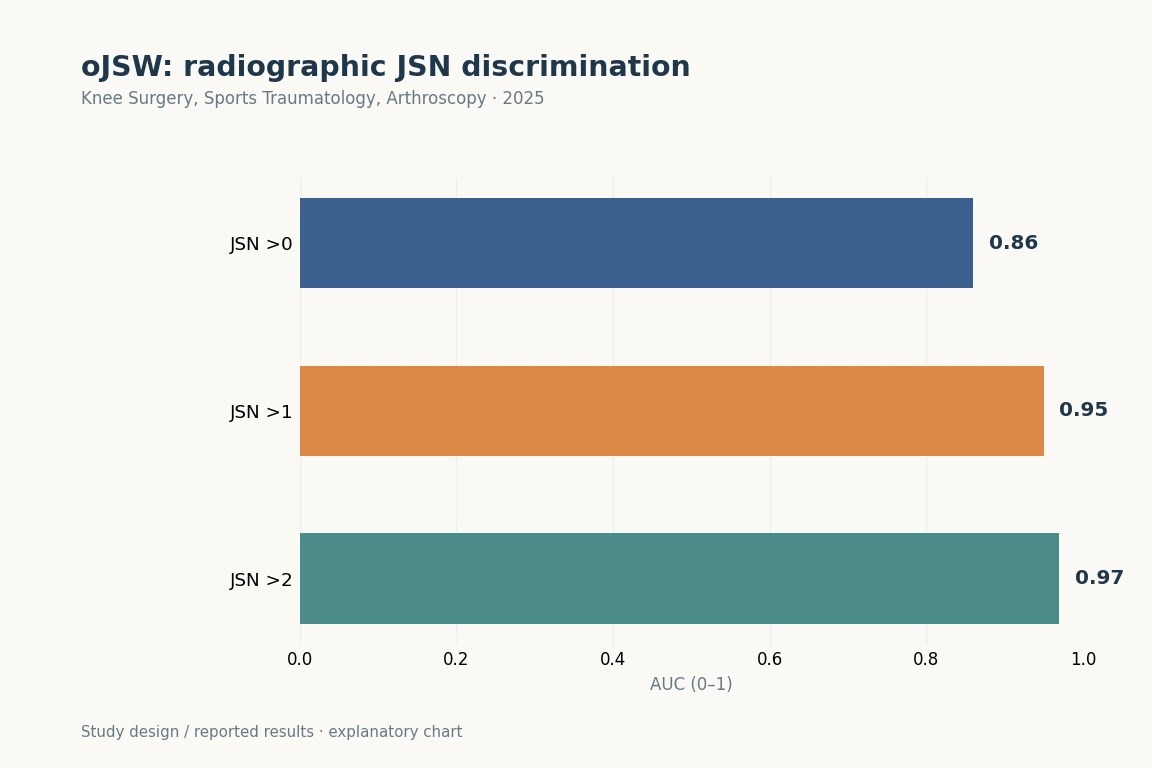
AUC was 0.86 for the earliest JSN distinction and 0.95 and 0.97 for more advanced stages.
2025 · arthritis inspection and surveillance · Figures and explanation

Can joint space be measured more accurately on X-rays?

We measured joint space with AI and we looked at the extent of arthritis and how it changed over time.

Drawing and research
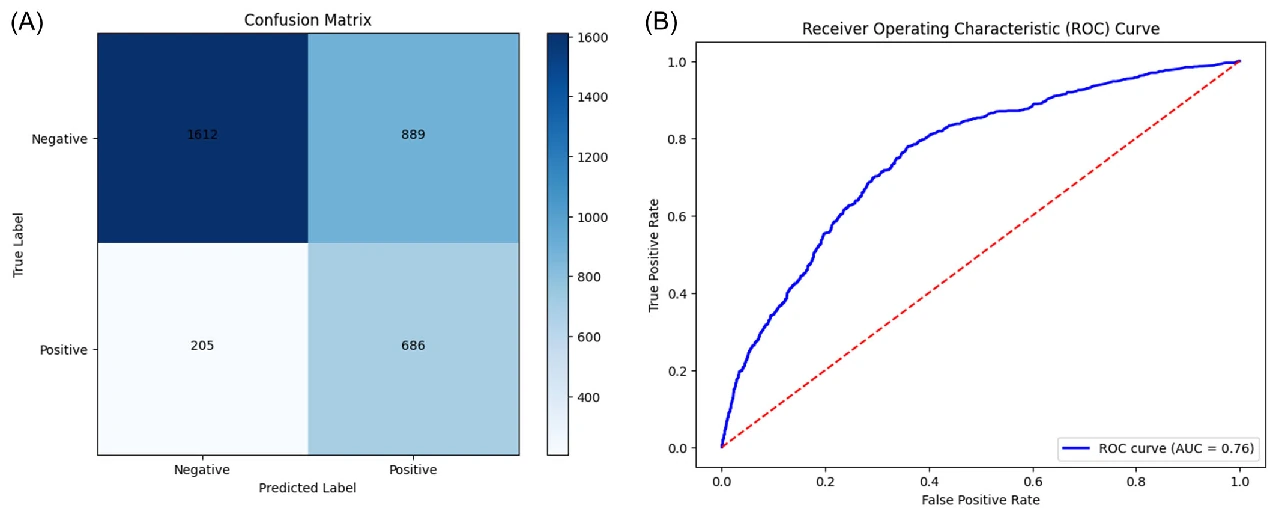
Confusion matrix and ROC curve in the independent MOST cohort. Radiographic progression was evaluated with AUC 0.76 and accuracy 0.68.
2025 · arthritis inspection and surveillance · Figures and explanation

Can we predict whether osteoarthritis will progress?

We tested models that combined X-rays and clinical information in other groups.

Drawing and research
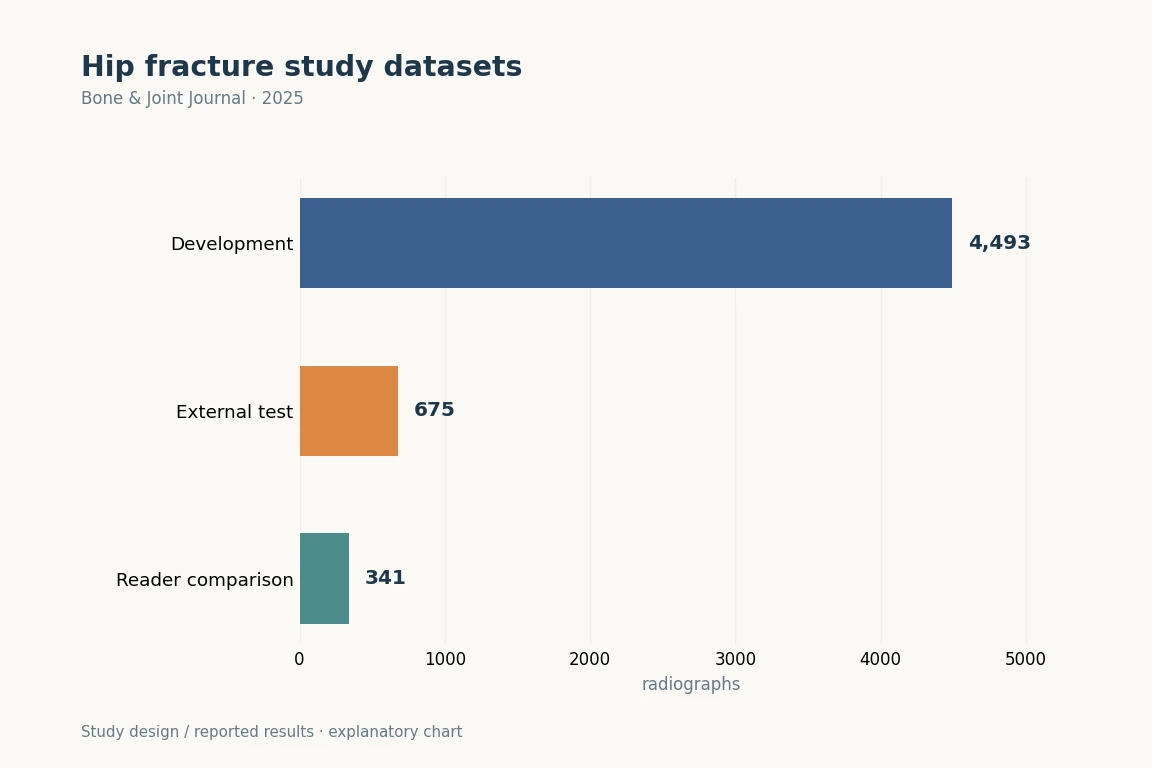
Development (4,493), external validation (675) and reader comparison (341) images are shown separately. The 341 are part of the external set; do not add the bars. Table III's 0.83–0.89 values are averages for three doctors and are not labelled as standalone AI sensitivity because descriptions of the evaluator are inconsistent.
2025 · AI and video testing. · Figures and explanation

Can AI help identify fractures?

We tested AI that classifies fracture patterns on hip X-rays and assists physician interpretation.

Drawing and research
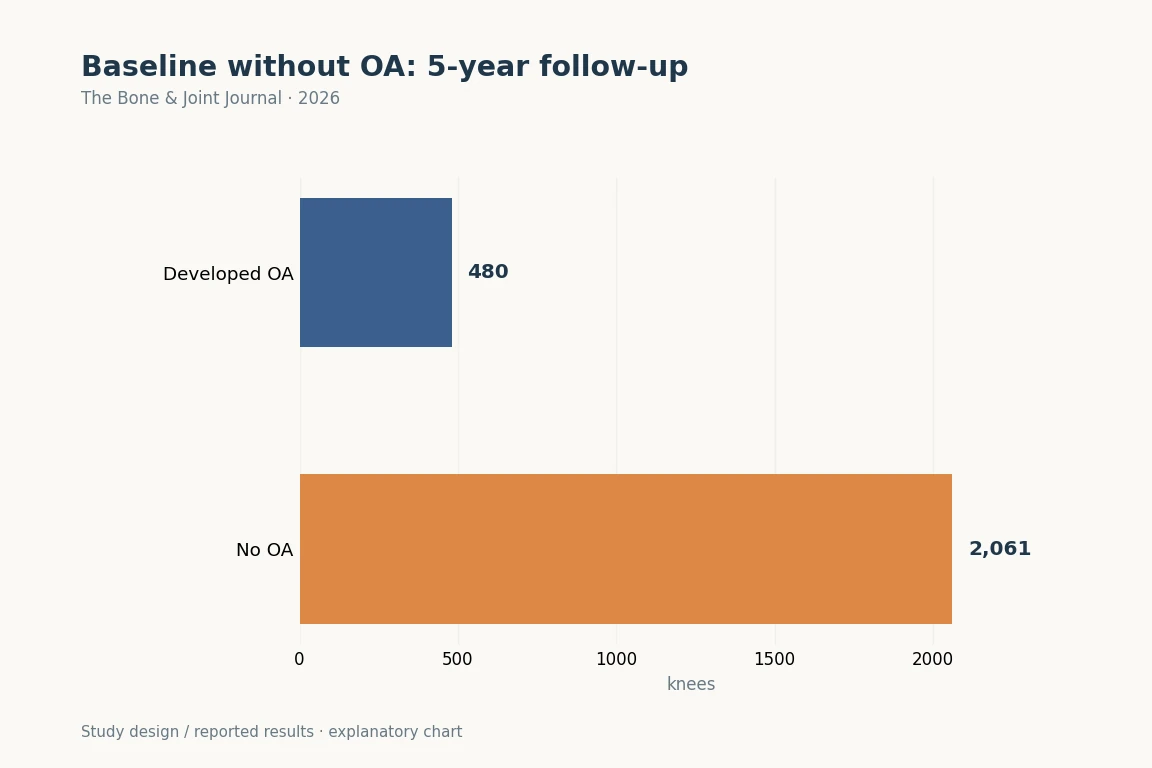
Among 2,541 knees without baseline OA, 480 developed OA over five years. The study examined continuous JLO measures and OA onset, beyond categorical alignment types.
2026 · knee shape and change · Figures and explanation

Can Knee Alignment Tell Us Who Will Develop Osteoarthritis?

In knees without OA followed for 5 years, joint-line obliquity, rather than the type number, was associated with OA onset.

Drawing and research
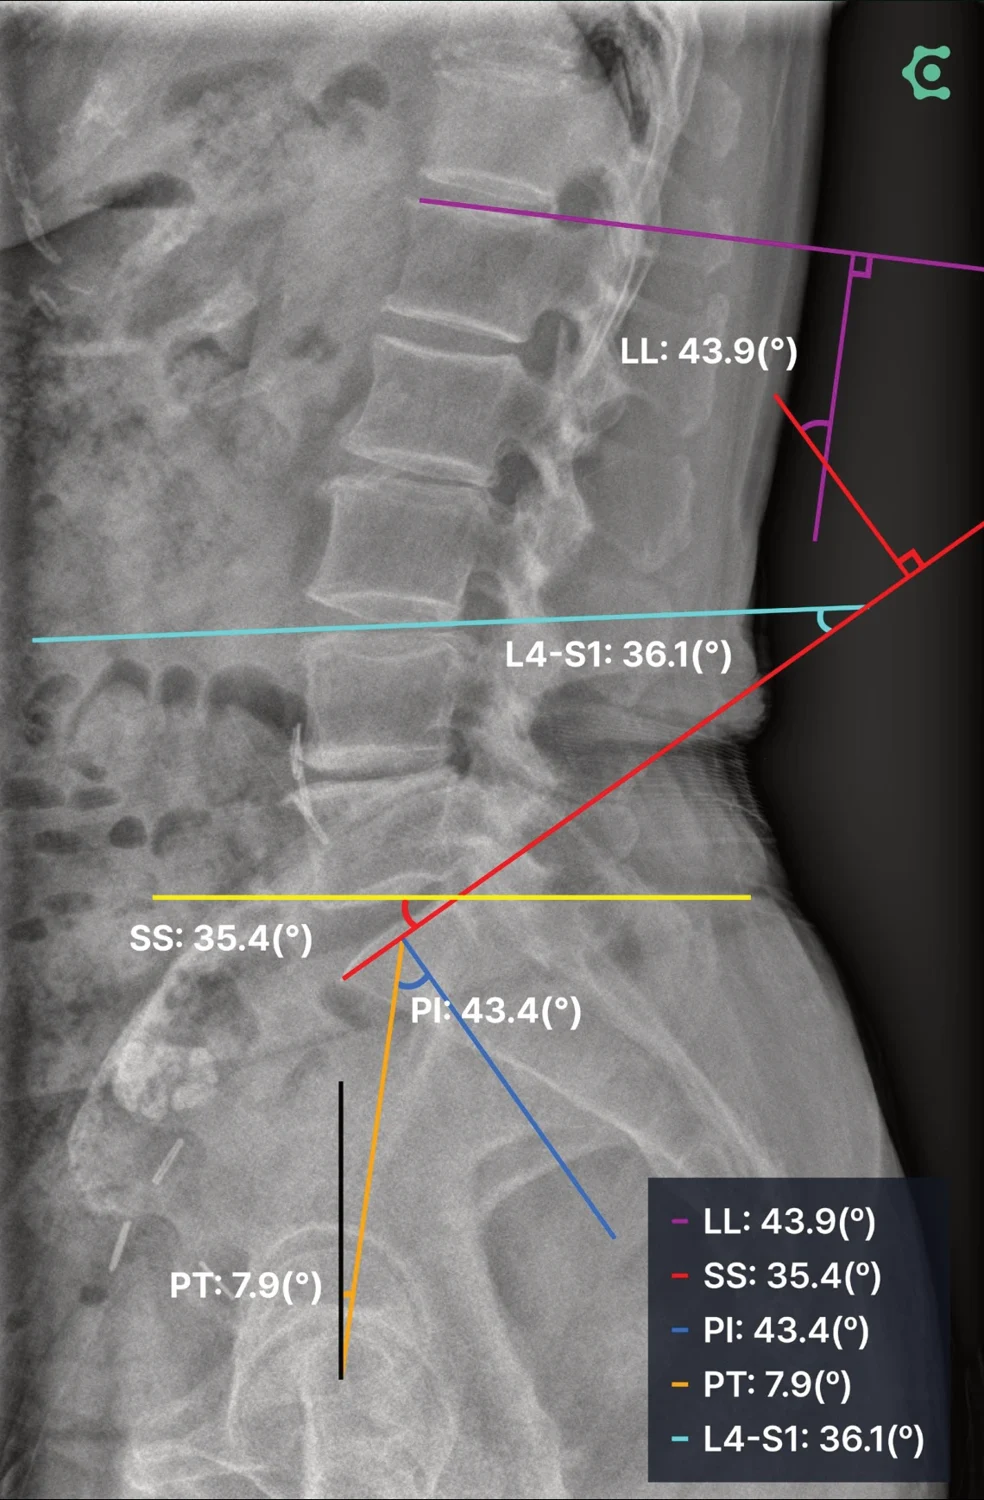
Spinopelvic measurement example from CONNEVO SPIN product materials
2025 · AI and video testing. · Figures and explanation

Can AI Measure Angles When the Spine Is Curved?

This study measures lumbar and pelvic angles automatically. Examples illustrate both small and large measurement errors.

Drawing and research
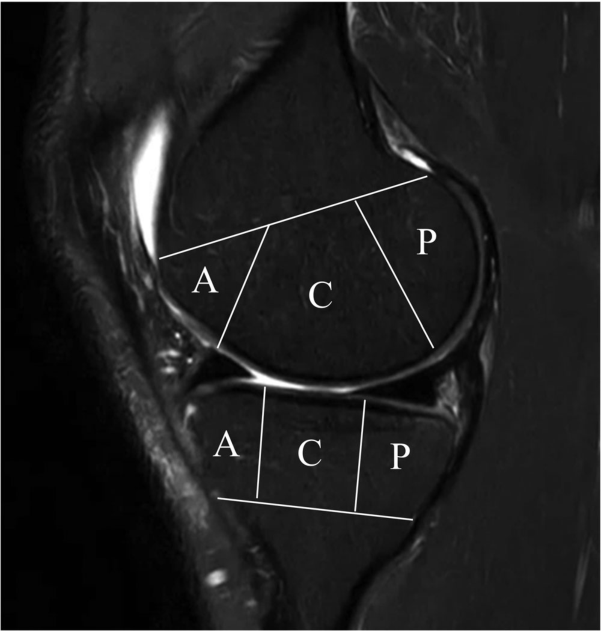
In an MRI, you divide the cartilage and cranial bone in front of A; in the middle of C; behind P. The same knee can vary the amount of tissue change depending on location, so we've broken down the layout.
2026 · arthritis inspection and surveillance · Figures and explanation

X-rays and MRI Show Different Aspects of Osteoarthritis

Long-term follow-up of the same knees showed that cartilage and meniscal changes occurred in different sequences depending on location.

Drawing and research
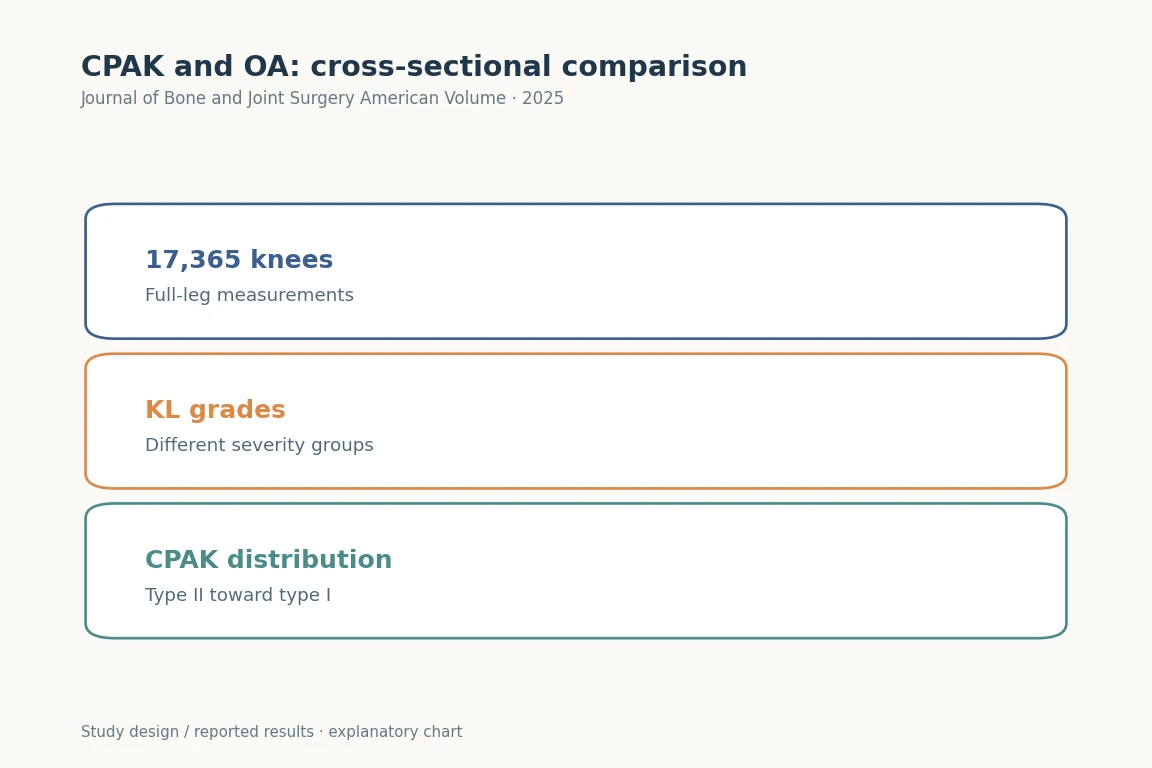
CPAK, aHKA and JLO distributions were compared by KL grade in 17,365 knees.
2025 · knee shape and change · Figures and explanation

Does severe arthritis change the shape of the knee?

This study compares alignment distributions across 17,365 knees with different OA grades.

Drawing and research
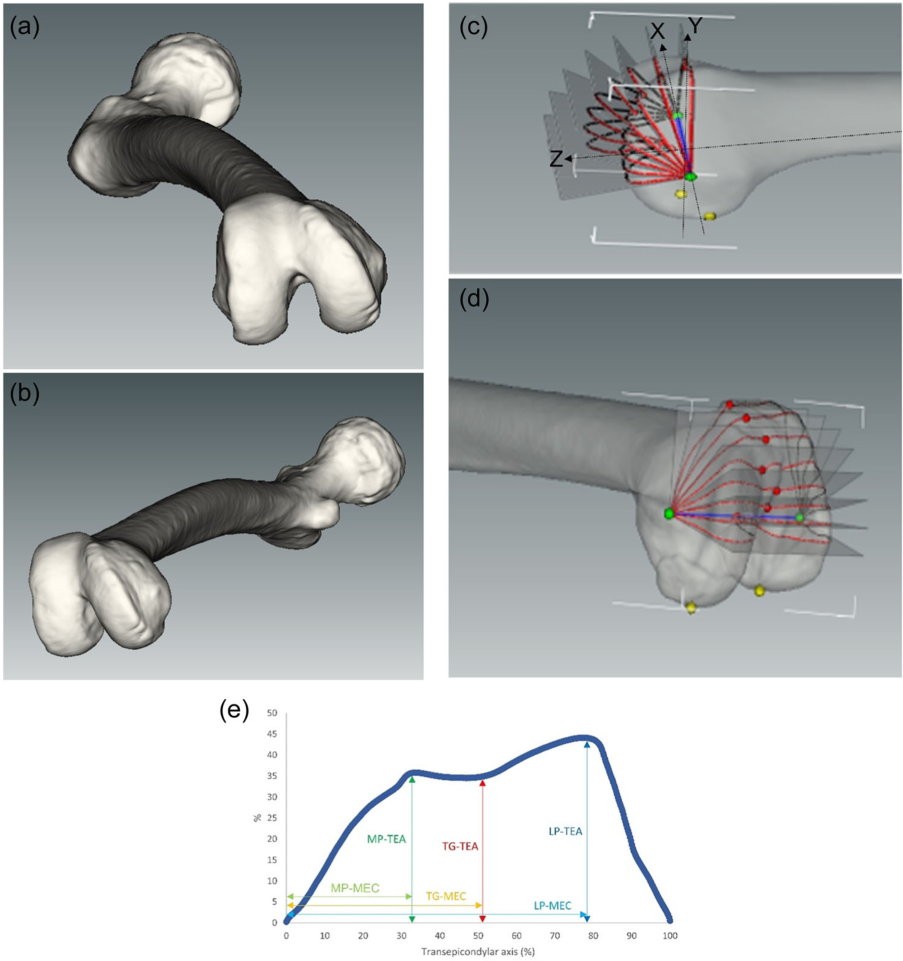
We use 3D CT to reconstruct the shape of the bow and take a steady axis and compare pieces at different heights. It's a way of describing where is narrower than the classification that you see in a side photo.
2024 · arthritis inspection and surveillance · Figures and explanation

Where is the groove at the front of the knee shallower?

Dividing the patellar groove into 3-dimensional regions revealed shape differences, particularly proximally.

Drawing and research
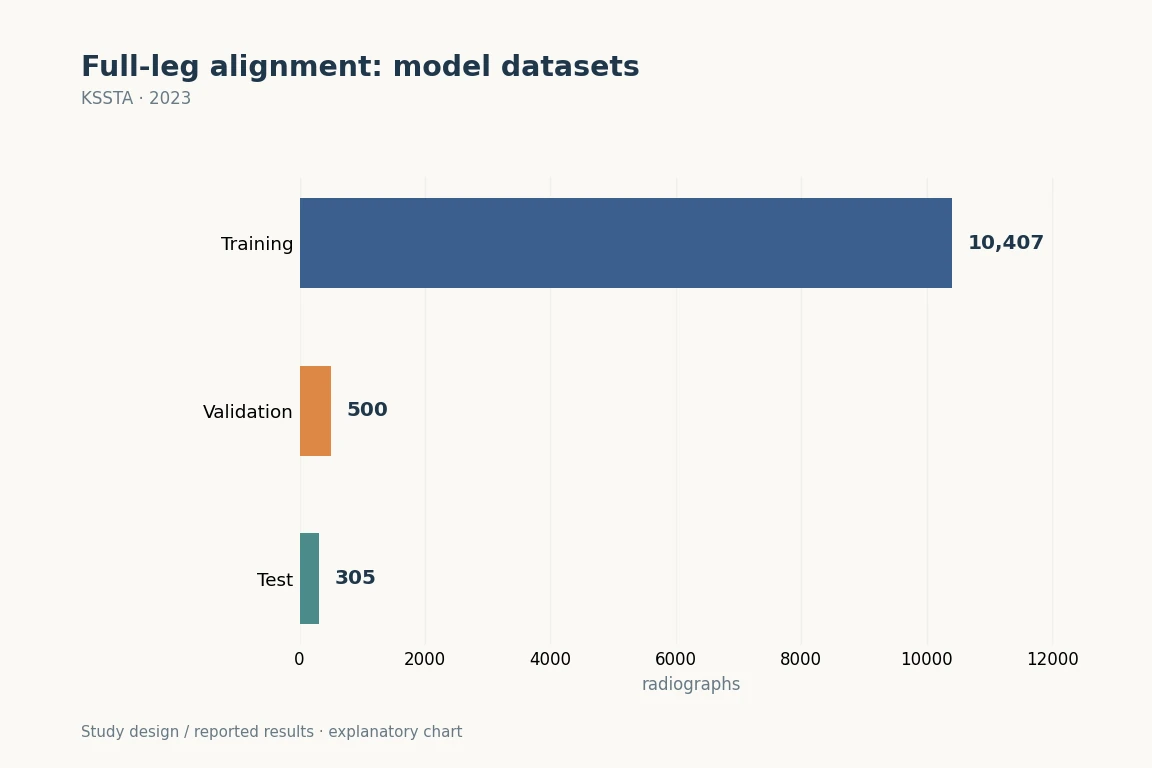
This single-institution study used 10,407 training, 500 validation and 305 test images. The figure shows the data split. Three-institution external validation was performed separately in the 2024 follow-up study.
2023 · AI and video testing. · Figures and explanation

What Does AI Detect on Full-Length Leg X-rays to Measure Alignment?

We identified 15 landmarks on images extending from the hip to the ankle and calculated whole-leg alignment angles.

Drawing and research
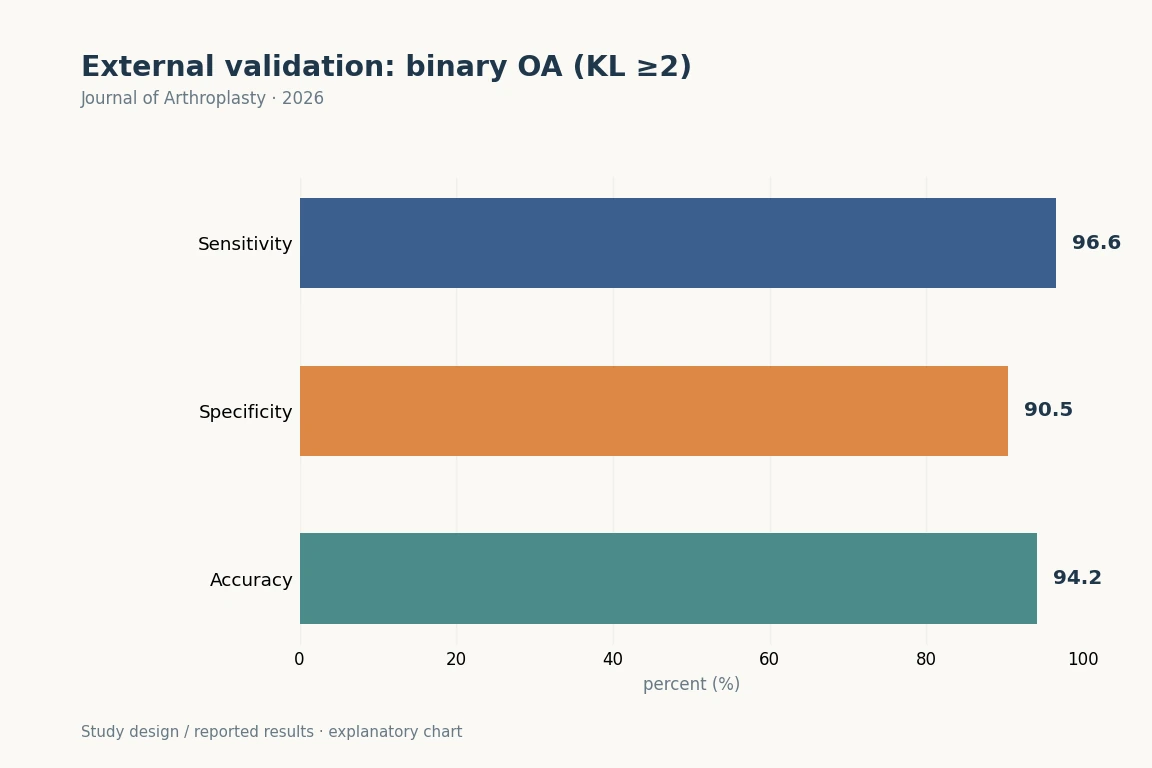
Across 2,546 knees, binary OA detection (KL ≥2) had sensitivity 96.6%, specificity 90.5% and accuracy 94.2%. These differ from grade-specific classification: KL 2 sensitivity was 77.2%.
2026 · AI and video testing. · Figures and explanation

Does AI grading of osteoarthritis work well at other hospitals?

The study separately evaluated OA detection and grade-specific classification in 2,546 knees from two Korean university hospitals.

Drawing and research
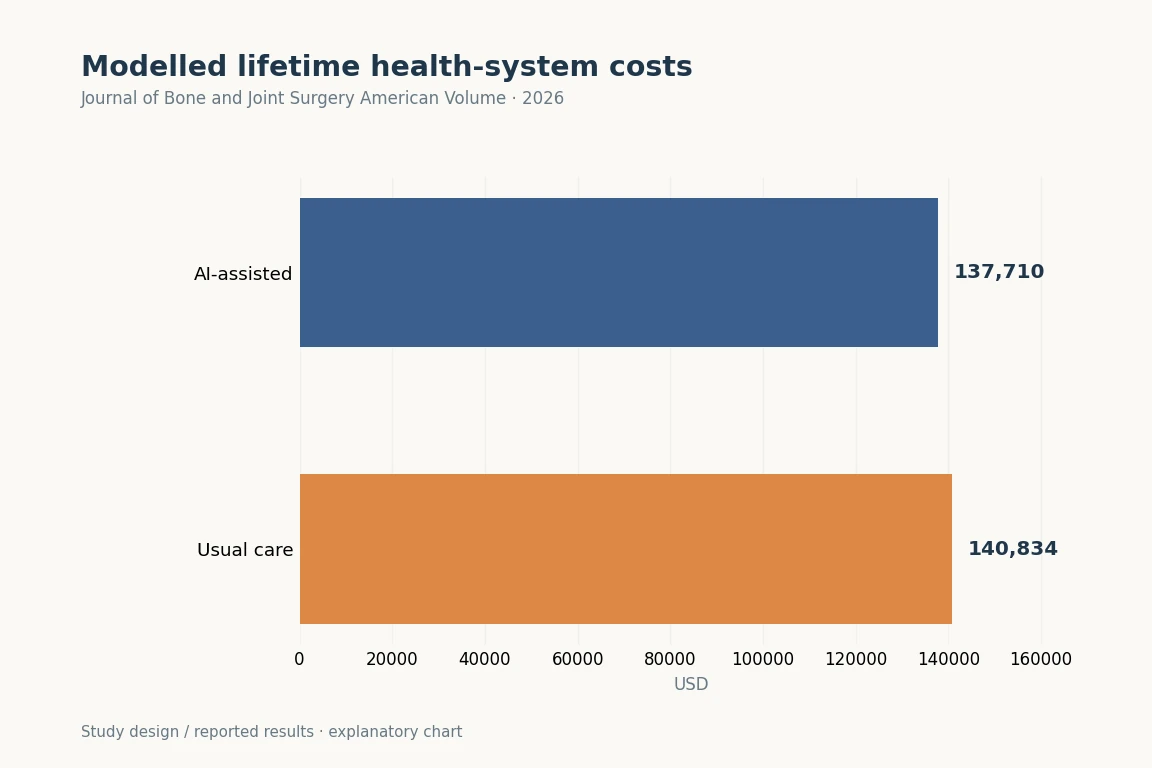
The model estimated lifetime costs of $137,710 for the AI strategy and $140,834 for usual assessment, with $3,125 lower incremental cost and 0.260 more QALYs.
2026 · AI and video testing. · Figures and explanation

How could imaging AI affect healthcare costs and quality of life?

The value of earlier diagnosis was estimated through lifetime costs and quality of life. This differs from measuring savings in real patients.

Drawing and research