R.Du Hyun RoOrthopedics & Research
Text
← The Story of Research

AI and video testing. · 2023

What Does AI Detect on Full-Length Leg X-rays to Measure Alignment?

We identified 15 landmarks on images extending from the hip to the ankle and calculated whole-leg alignment angles.

KSSTA · Changwung Jo, Doohyun Hwang, Sunho Ko et al. · Du Hyun Ro

Results explained with study numbers

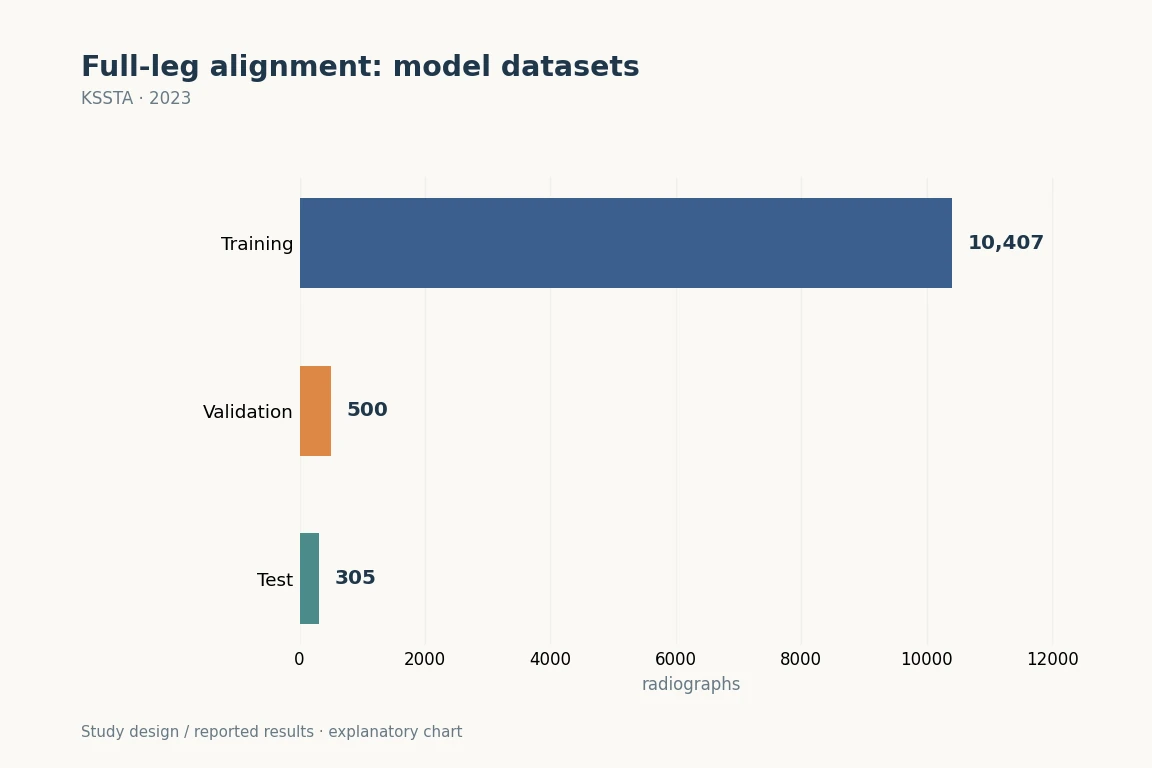
This single-institution study used 10,407 training, 500 validation and 305 test images. The figure shows the data split. Three-institution external validation was performed separately in the 2024 follow-up study.Enlarge Figure

This single-institution study used 10,407 training, 500 validation and 305 test images. The figure shows the data split. Three-institution external validation was performed separately in the 2024 follow-up study.

KSSTA (2023). DOI: 10.1007/s00167-022-07124-x · Original explanatory chart based on reported data

Evidence & Original SourceImage use terms
01

I'm going from hip joint to the ankle.

A close-up knee image cannot fully show whole-leg loading and bone angles. Standing full-length X-rays include the hip, knee and ankle. Planning arthroplasty or osteotomy involves placing landmarks and connecting lines to measure alignment; we developed a way to automate this repeated work.

02

First, you find the joint and then you find a point inside it.

11,212 images were used to develop and evaluate the model. After locating hip, knee and ankle regions, it identifies 15 anatomical landmarks—the starting points for angle measurement. Specialist reference measurements were used; 305 images not used for training formed a separate test set.

03

So I repeated the same angle, and I checked to see if it could be solved.

Agreement between the model and reference measurements was high for each angle, and repeated measurement of the same image was consistent. Mean absolute errors were below 0.52° for angles other than JLCA. A small average error does not mean that every image has a small error. Outliers and angle-specific performance should be checked together.

04

joint line read the angle between them carefully.

JLCA is the small angle between the femoral and tibial joint surfaces. It should not be described as having the same accuracy as the other larger alignment angles. Degenerative blurring of the boundaries and differences in positioning rotation may change landmark detection. The original paper also shows difficult images so readers can inspect what the model detected.

05

Automatic measurement is followed by the doctor's interpretation.

Fast angle measurement and choosing a surgical target are different tasks. Clinicians still assess bony versus intra-articular deformity, symptoms, and movement. This study was internal validation at one institution, so confirmation elsewhere is needed. Repeatable measurements are a foundation for better research and planning.

Look at the study numbers again.

11,212Development and evaluation images
15Anatomical landmarks
305Test images
RESEARCH FINDINGThe video.

Composition of the study sample

Development and evaluation images
11,212
06,446.912,893.8
Counts of data included in the study. These do not show treatment effects or an individual’s risk.

Common Questions

Can we apply these results directly to individual therapies?

Fast angle measurement and choosing a surgical target are different tasks. Clinicians still assess bony versus intra-articular deformity, symptoms, and movement. This study was internal validation at one institution, so confirmation elsewhere is needed. Repeatable measurements are a foundation for better research and planning.

Methods and Numbers in Detail

Deep learning-based landmark recognition and angle measurement of full-leg plain radiographs can be adopted to assess lower extremity alignment

Participants and Methods

The dataset contained 11,212 full-length lower-limb radiographs: 10,407 for training, 500 for validation, and 305 for testing. Right-leg images were used to reduce duplication in training.

After separating the hip, knee, and ankle ROIs, the model detected 15 anatomical landmarks to calculate mLDFA, MPTA, JLCA, and HKAA. Inter- and intra-observer ICCs, mean absolute errors, and outliers were assessed against specialist reference values.

Results Reported in the Paper

  1. Angle-specific inter-observer ICCs for the automatic model were ≥0.98; repeat-measurement ICC was 1.00.
  2. For angles other than JLCA, mean absolute errors were below 0.52° and outlier rates were below 4.26%.
  3. Definitions and errors differed by angle. Measurement reproducibility and failures of landmark detection should be examined together.

Scope of Interpretation

This was retrospective internal validation at a single center; performance at external institutions was not directly evaluated. The development data focused on right lower limbs, and image quality and positioning rotation must be considered. JLCA should not be grouped with the other angles to claim that all measurement errors were below 0.52°.

Keywords

Abstract · Original text

Changwung Jo, Doohyun Hwang, Sunho Ko, Myung Ho Yang, Myung Chul Lee, Hyuk-Soo Han, Du Hyun Ro. Deep learning-based landmark recognition and angle measurement of full-leg plain radiographs can be adopted to assess lower extremity alignment. Knee surgery, sports traumatology, arthroscopy : official journal of the ESSKA. 2023;31(4):1388-1397. doi:10.1007/s00167-022-07124-x.

PURPOSE

Evaluating lower extremity alignment using full-leg plain radiographs is an essential step in diagnosis and treatment of patients with knee osteoarthritis. The study objective was to present a deep learning-based anatomical landmark recognition and angle measurement model, using full-leg radiographs, and validate its performance.

METHODS

A total of 11,212 full-leg plain radiographs were used to create the model. To train the data, 15 anatomical landmarks were marked by two orthopaedic surgeons. Mechanical lateral distal femoral angle (mLDFA), medial proximal tibial angle (MPTA), joint line convergence angle (JLCA), and hip-knee-ankle angle (HKAA) were then measured. For inter-observer reliability, the inter-observer intraclass correlation coefficient (ICC) was evaluated by comparing measurements from the model, surgeons, and students, to ground truth measurements annotated by an orthopaedic specialist with 14 years of experience. To evaluate test-retest reliability, all measurements were made twice by each measurer. Intra-observer ICCs were then derived. Performance evaluation metrics used in previous studies were also derived for direct comparison of the model's performance.

RESULTS

Inter-observer ICCs for all angles of the model were 0.98 or higher (p < 0.001). Intra-observer ICCs for all angles were 1.00, which was higher than that of the orthopaedic specialist (0.97-1.00). Measurements made by the model showed no significant systemic variation. Except for JLCA, angles were precisely measured with absolute error averages under 0.52 degrees and proportion of outliers under 4.26%.

CONCLUSIONS

The deep learning model is capable of evaluating lower extremity alignment with performance as accurate as an orthopaedic specialist with 14 years of experience.

LEVEL OF EVIDENCE

III, retrospective cohort study.