R.Du Hyun RoOrthopedics & Research
Text
← The Story of Research

arthritis inspection and surveillance · 2025

Can we predict whether osteoarthritis will progress?

We tested models that combined X-rays and clinical information in other groups.

Journal of Orthopaedic Research · Lee DW, Han HS, Ro DH, Lee YS

Original Figure 2

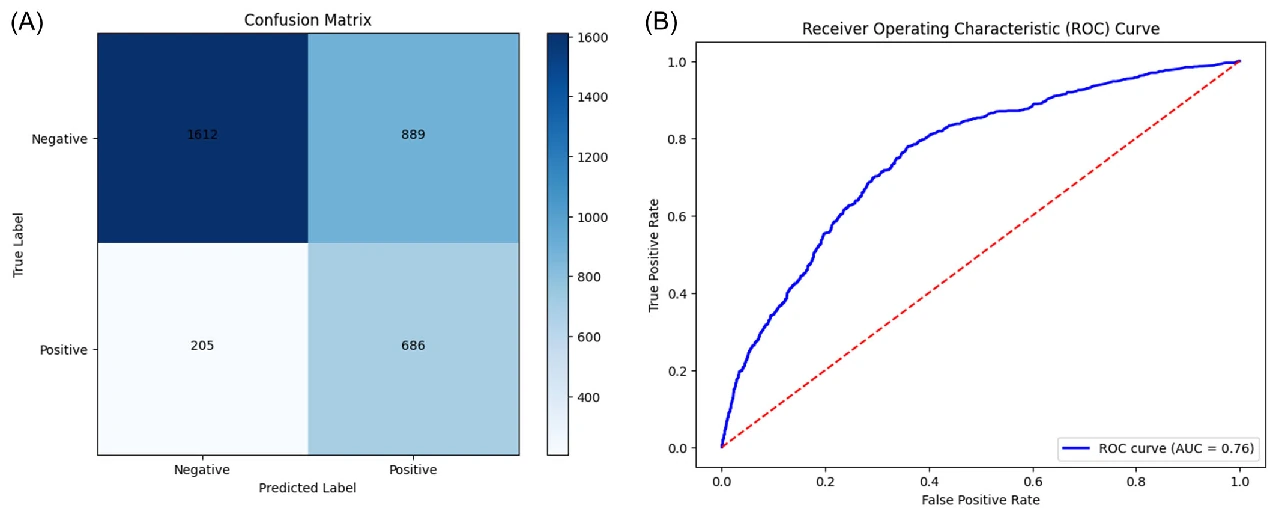
Confusion matrix and ROC curve in the independent MOST cohort. Radiographic progression was evaluated with AUC 0.76 and accuracy 0.68.Enlarge Figure

Confusion matrix and ROC curve in the independent MOST cohort. Radiographic progression was evaluated with AUC 0.76 and accuracy 0.68.

Journal of Orthopaedic Research (2025). DOI: 10.1002/jor.25982 · Original Figure 2

Evidence & Original SourceImage use terms
01

The picture now and the changes ahead are different questions.

After an early-arthritis diagnosis, you may wonder how quickly it will progress. Classifying the current X-ray well does not automatically mean predicting the future well. A prediction study must test whether initial information distinguishes outcomes several years later.

This study developed a model to predict radiographic progression over 4–5 years in knees with early OA. It combined information relatively easy to obtain in clinical practice and evaluated performance outside the development data set.

02

And we did it in one study group, and we tested it in another.

The study included knees with baseline KL grades 0, 1 or 2. A Random Forest model was developed on 5,966 OAI knees and externally validated on 3,392 knees in the independent MOST data set. These counts refer to knees, not people.

External validation tests a model in a separate group not used for development. It is needed because performance on familiar development data may not carry over to new data. It is different from solving the same examination again.

Progression was defined by an increase in radiographic KL grade; a change from 0 to 1 was considered minor and excluded. OAI was assessed at 4 years and MOST at 5 years. Their different follow-up schedules explain the phrase “4–5 years.”

03

I used X-ray imaging and fitness, symptom dialysis.

The final model selected 6 variables: baseline KL grade, contralateral OA, lateral narrowing grade, BMI, medial narrowing grade and total WOMAC. WOMAC asks about joint pain, stiffness and function.

Selection of these variables does not mean that changing one prevents progression. Predictive information and factors whose treatment benefits patients are different questions. The model also does not rely on a single test alone.

Original Figure 3
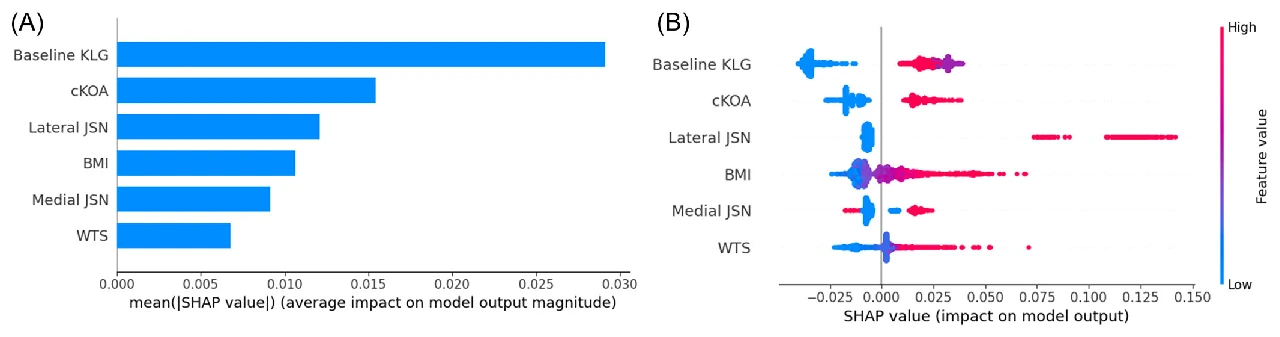
SHAP analysis of the six predictors shows contributions of baseline KL grade, contralateral OA, joint space narrowing, BMI and WOMAC.Enlarge Figure

SHAP analysis of the six predictors shows contributions of baseline KL grade, contralateral OA, joint space narrowing, BMI and WOMAC.

Journal of Orthopaedic Research (2025). DOI: 10.1002/jor.25982 · Original Figure 3

Original Figure 5
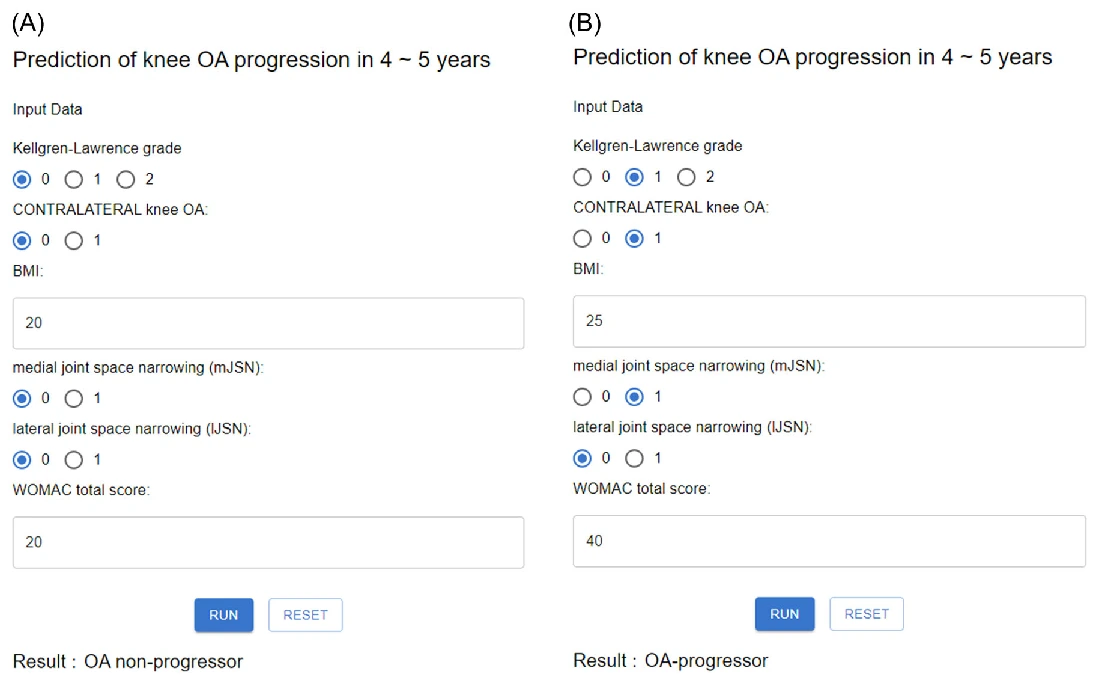
The paper shows example inputs and outputs from its web model. The prediction target was radiographic progression over 4–5 years.Enlarge Figure

The paper shows example inputs and outputs from its web model. The prediction target was radiographic progression over 4–5 years.

Journal of Orthopaedic Research (2025). DOI: 10.1002/jor.25982 · Original Figure 5

04

External verification AUC was 0.76.

External validation in MOST reported AUC 0.76, accuracy 0.68, and F1 0.56. AUC describes discrimination between knees that progressed and those that did not. Accuracy and F1 are different performance measures, so the three numbers should not be read as interchangeable.

An AUC of 0.76 does not mean “a 76% chance that my arthritis will progress.” Interpreting an individual prediction requires their inputs, the model’s probability calculation and validation in the clinical population. This result does not demonstrate perfect prediction.

05

It's not pain or surgery.

The target was KL-grade progression over 4–5 years. Radiographic progression, daily symptoms and when surgery is needed may be related, but are different outcomes. This model’s performance should not be described as predicting pain or timing of surgery.

The study suggests ways to design more detailed follow-up. Whether clinical use benefits patients, and whether it performs adequately in other populations and hospitals, require further validation.

Development and validation follow-up periods were not identical. External validation should be read with both its strength—testing a separate group—and differences in group composition and observation conditions in mind.

Look at the study numbers again.

5,966Developed by knee
3,392Validation knees · MOST
0.76External verification AUC
RESEARCH FINDINGScore.

Most external verification performance indicators

AUC
0.76
Accuracy.
0.68
F1
0.56
00.51
AUC, accuracy, and F1 are different performance measures. This is not a comparison between models.

Common Questions

Can you calculate my chances of progress on this website?

This page explains the research. It doesn't have the ability to provide a verified personal risk calculator or make medical decisions based on input information.

If the knee on the other side is sick, will my knee also proceed?

The arthritis on the other side is one of a number of information selected from the model. One factor alone cannot determine the progress of an individual.

Terms in This Article
External verification
It's the process of checking performance from other data that hasn't been used in model development.
AUC
It's a performance indicator that distinguishes advanced and unprogressed knee. It's different from the probability of a person progressing.
Body mass index.
It's a fitness indicator that we calculate by height and weight. It's also called BMI.
Methods and Numbers in Detail

Externally validated machine learning for radiographic OA progression

Participants and Methods

Development: 5,966 OAI knees · Validation: 3,392 MOST knees

A Random Forest model was developed using OAI and externally validated in the independent MOST data set. Six predictors were selected from imaging findings and clinical variables.

Results Reported in the Paper

  1. External validation yielded an AUC of 0.76, accuracy of 0.68, and F1 score of 0.56.
  2. Selected variables were baseline KL, contralateral OA, lateral JSN, BMI, medial JSN and total WOMAC score.
  3. Validation in a separate cohort assessed prediction performance beyond the original dataset.

Scope of Interpretation

The target is radiographic progression, not a direct prediction of pain or the need for surgery. An AUC of 0.76 does not mean perfect individual prediction; clinical implementation requires further validation.

Keywords

Abstract · Original text

Do Weon Lee, Hyuk-Soo Han, Du Hyun Ro, Yong Seuk Lee. Development of the machine learning model that is highly validated and easily applicable to predict radiographic knee osteoarthritis progression. Journal of orthopaedic research : official publication of the Orthopaedic Research Society. 2025;43(1):128-138. doi:10.1002/jor.25982.

Many models using the aid of artificial intelligence have been recently proposed to predict the progression of knee osteoarthritis. However, previous models have not been properly validated with an external data set or have reported poor predictive performances. Therefore, the purpose of this study was to design a machine learning model for knee osteoarthritis progression, focusing on high validation quality and clinical applicability. A retrospective analysis was conducted on prospectively collected data, using the Osteoarthritis Initiative data set (5966 knees) for model development and the Multicenter Osteoarthritis Study data set (3392 knees) for validation. The analysis aimed to predict Kellgren-Lawrence grade (KLG) progression over 4-5 years in knees with initial KLG of 0, 1, or 2. Possible predictors included demographics, comorbidities, history of meniscectomy, gait speed, Western Ontario and McMaster Universities Osteoarthritis Index (WOMAC) scores, and radiological findings. The Random Forest algorithm was employed for the predictive model development. Baseline KLG, contralateral knee osteoarthritis, lateral joint space narrowing (JSN) grade, BMI, medial JSN grade, and total WOMAC score were six features selected for the model in descending order of importance. Odds ratios of baseline KLG, contralateral knee osteoarthritis, and lateral JSN grade were 1.76, 2.59, and 4.74, respectively (all p < 0.001). The area-under-the-curve of the ROC curve in the validation set was 0.76 with an accuracy of 0.68 and an F1-score of 0.56. The progression of knee osteoarthritis in 4 ~ 5 years could be well-predicted using easily available variables. This simple and validated model may aid surgeons in knee osteoarthritis patient management.