What does a narrowed joint space on an X-ray mean?
Knee X-rays show the space between bones. They do not directly show cartilage, but the space provides a clue to joint structure. Studying how much it narrows over time requires repeatable measurement by the same criteria.
The paper redefines where and in which direction joint space is measured. Understanding what the researchers designed AI to measure comes before judging how well it performed.
Instead of the fixed position, we found the narrowest gap in a constant direction.
Conventional methods measure joint space at fixed positions on the tibial surface. This method measures perpendicular to the tibial joint line in a standardized medial-knee region, then finds the narrowest distance. This is orthogonal minimum joint-space width, or oJSW.
15,313 X-rays from 3,855 OAI participants were analyzed, spanning baseline to a maximum of 72 months. The new deep-learning-derived measure was compared with conventional fixed-location measurements. The figure 15,313 counts images, not patients.
We've got a better understanding of the extent to which joint space is narrowed down.
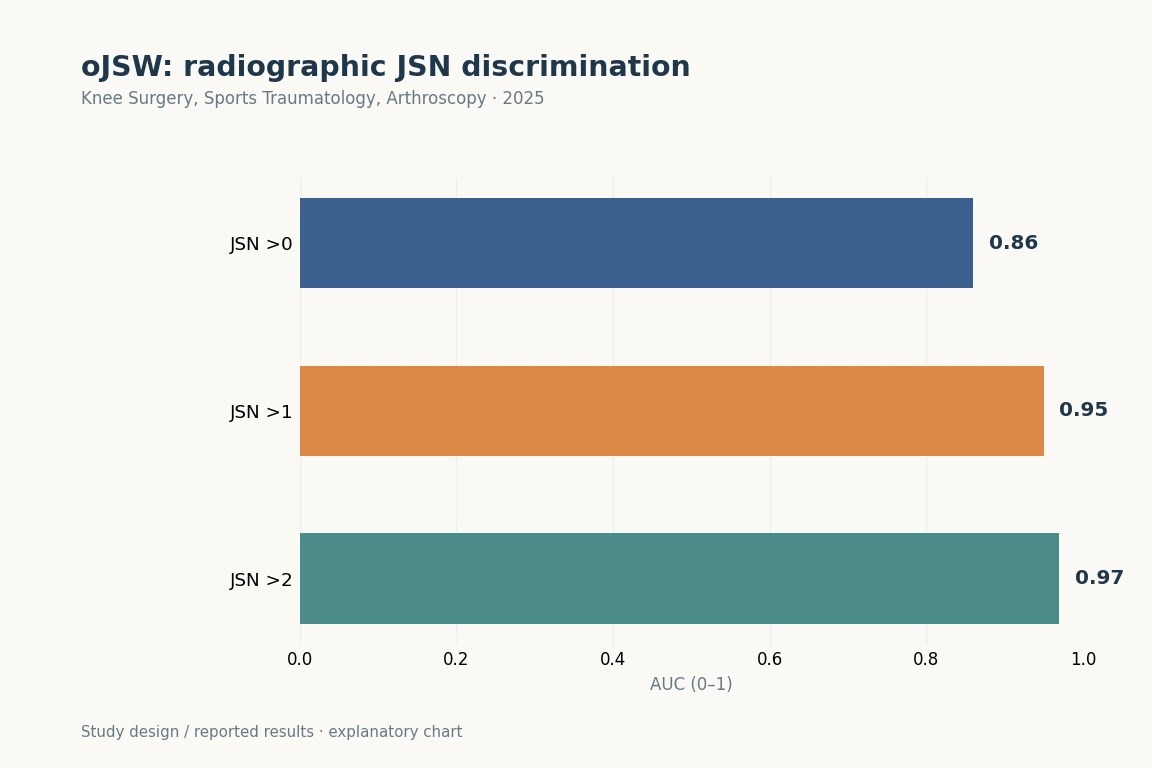
AUCs for discriminating JSN >0, >1 and >2 were 0.86, 0.95 and 0.97, respectively. The abstract summarises the absolute AUC advantage over fixed-location JSW as 0.04–0.08. These are cross-sectional discrimination results, not an individual’s probability of future osteoarthritis progression.
It's a study that attempts to record small changes in numbers.
Grades conveniently summarize a condition into categories. A continuous joint-space measurement can also study differences within the same grade. Repeatable measures are needed to evaluate treatment or natural history.
This AI automates a specified measurement. It does not replace all medical judgment or determine pain and surgery timing from one X-ray. Better measurement and better treatment outcomes from using that measurement require separate evidence.
You don't want to read AUC 0.97 as a prediction of the future.
The largest value, 0.97, describes discrimination of JSN >2. It does not mean a 97% chance of future OA progression or that diagnosis is always 97% accurate. First check the outcome against which AUC was calculated.
Even with follow-up images, these findings do not directly predict an individual’s future pain or need for joint replacement. They show potential as a structural-change measure; clinical usefulness in particular situations requires separate validation.
The baseline, 2-year and 6-year images in the original figure illustrate the measurement method. A single example should not be read as the average course of all participants. Long follow-up alone does not show that everyone changed at the same rate.