OA images are often explained by grade. Grades aid comparison, but knees within one grade differ in appearance and course: some show prominent osteophytes, others earlier narrowing, and alignment changes at different rates. The OARSI lecture discussed studying these differences with imaging biomarkers and AI measurement.
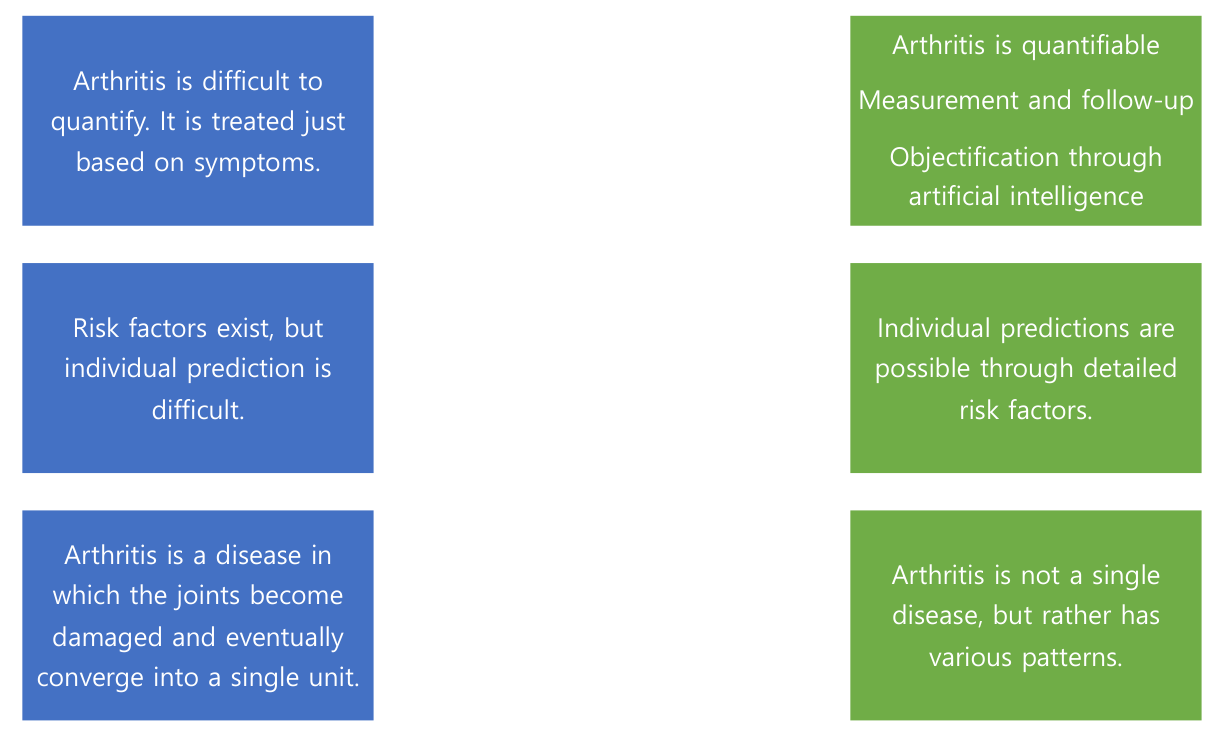
Quantitative joint assessment
The research approach connects objective joint assessment and quantitative measures to prognostic prediction.
Du Hyun Ro · APKASS lecture figure
Classifying severity and measuring change
KL grades are widely useful but may miss small, site-specific changes. Millimeter joint-space or continuous alignment measurements can reveal information between grades. More decimal places alone do not make a better marker: assess repeatability, positioning effects and responsiveness to real change.
What a narrower joint space means
X-ray joint space reflects information from cartilage and menisci. The MOST X-ray–MRI study found location-specific tissue changes and an important association of meniscal extrusion with progression. The question is what tissue a number reflects, rather than obtaining more MRI for everyone. Reading original figures helps show what each test depicts.
AI applies a consistent ruler to many images
Finding landmarks and repeatedly measuring angles on full-leg images takes time. Our group studies automatic landmark detection, angles, and joint-space measurement. Repeatability and closeness to reference values are different abilities. Examine failures hidden behind averages; poor images or unfamiliar settings mean automatic results cannot simply be accepted.
Connect structure and progression without assuming causation
JLCA–alignment progression and CPAK–OA severity studies suggest candidate markers for understanding the knee’s course. Association does not prove that changing an angle prevents progression. Validation must extend to surgical targets, pain and function, and long-term outcomes. That is why exploratory lecture examples are not transferred into established clinical cutoffs.
Bring the results back as clearer patient explanations
Detailed measurement is not for producing more numbers. It should explain change and uncertainty and clarify what matters to the patient when choosing care. Walking, sleep, work, and sport bring different goals. Shared decision-making research evaluates this process. Accurate explanation separates what the study shows from what still needs testing.
AUC varied with the narrowing threshold
AUCs for discriminating JSN >0, >1 and >2 were 0.86, 0.95 and 0.97, respectively. The abstract summarises the absolute AUC advantage over fixed-location JSW as 0.04–0.08. These are cross-sectional discrimination results, not an individual’s probability of future osteoarthritis progression.